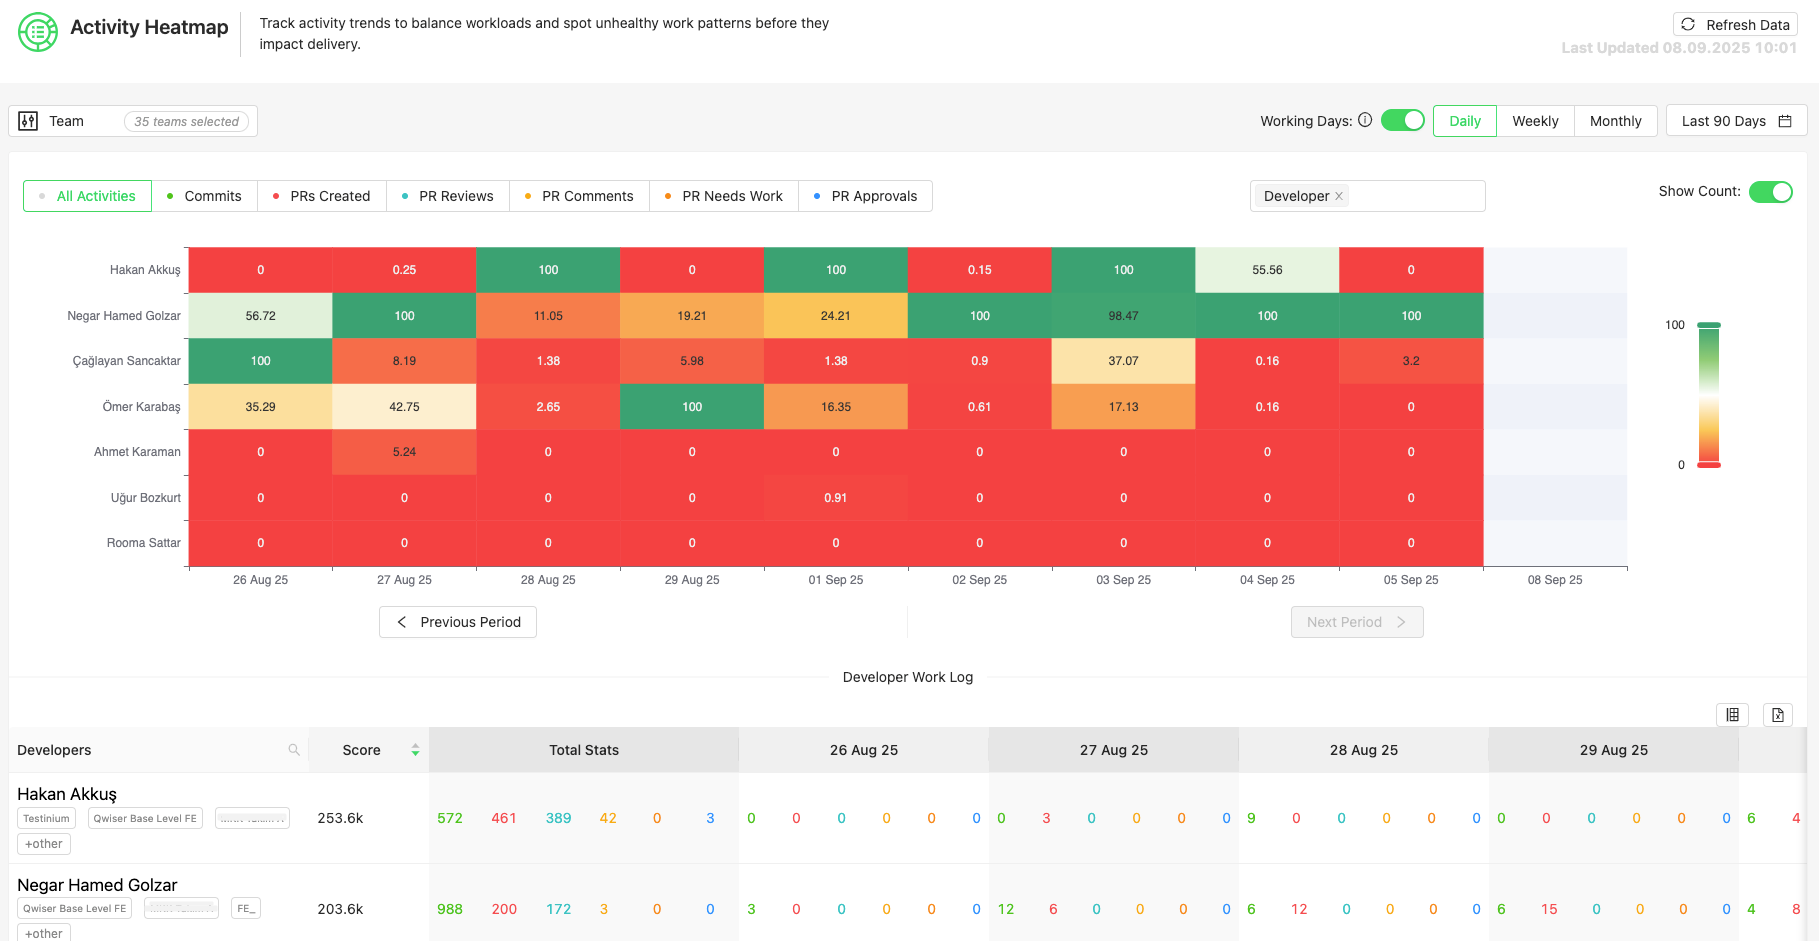
Activity Heatmap Overview
Activity Heatmap Overview
| Activity | Description | Default |
|---|---|---|
| Commits | Number of commits made | 2.0 |
| Lines Added | Number of lines of code added | 0.1 |
| Lines Deleted | Number of lines of code deleted | 0.1 |
| Lines Edited | Number of lines of code modified | 0.1 |
| PRs Created | Number of pull requests created | 1.0 |
| PR Reviews | Number of code reviews performed | 1.5 |
| PR Approvals | Number of pull requests approved | 0.25 |
| PR Needs Work | Number of pull requests sent back for changes | 0.5 |
| PR Comments | Number of comments made on pull requests | 1.0 |

Admin Panel – Activity Coefficients
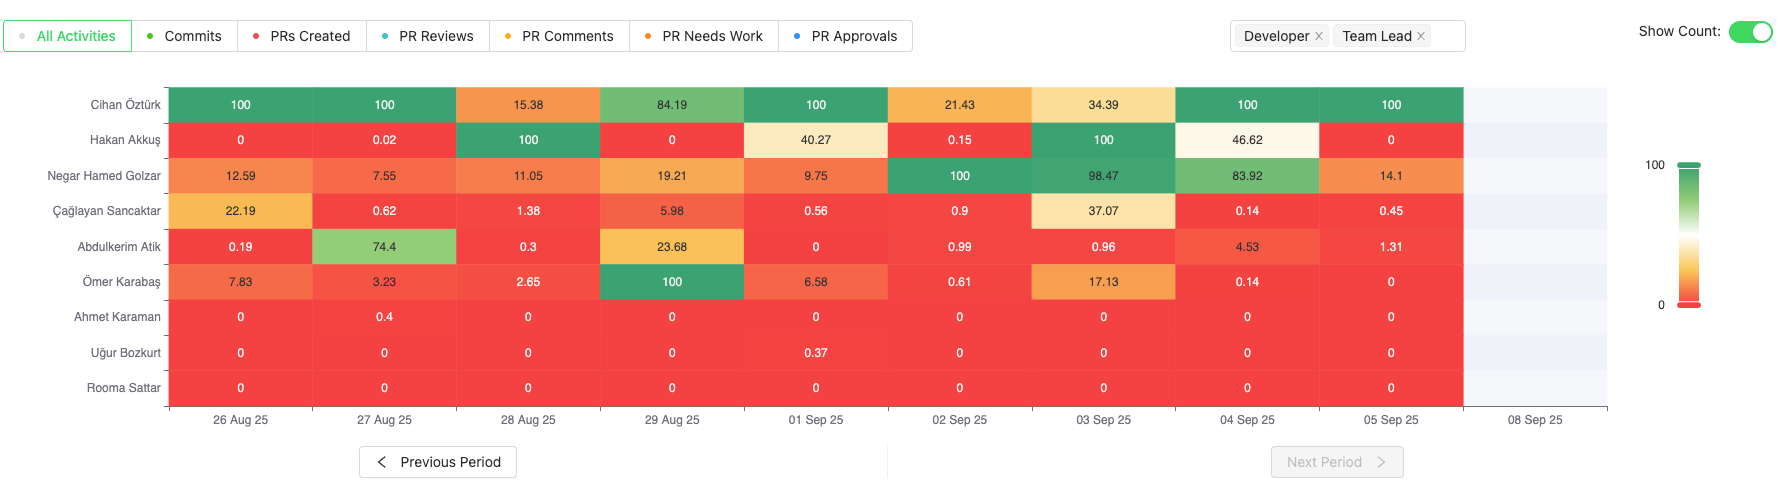
Activity Heatmap
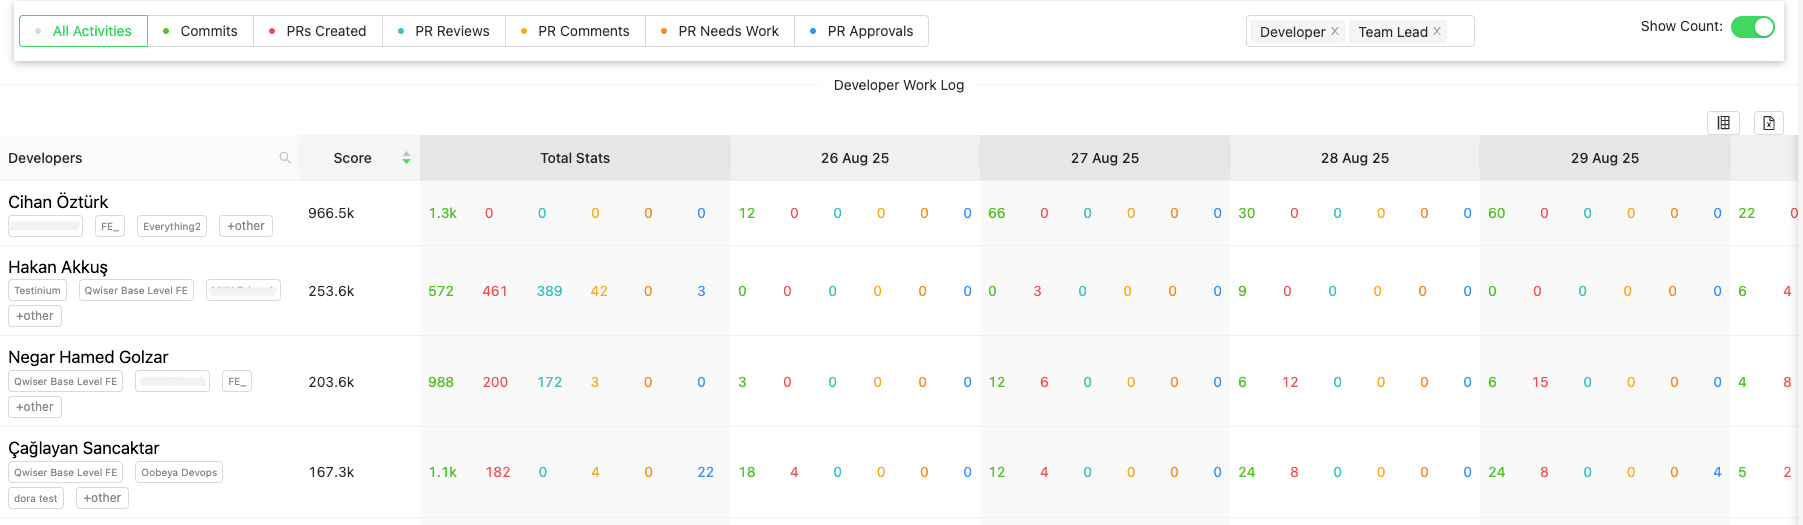
Developer Work Log
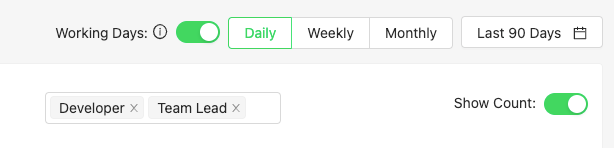
Module Filters
| Scenario | Benefit |
|---|---|
| Sprint Reviews | Analyzes contribution intensity at the end of a sprint, supporting healthier retrospectives. |
| Workload Balance | Identifies overloaded or low-participation team members to rebalance task assignments. |
| Engagement & Motivation | Helps spot developers with consistently low contributions and supports motivation-boosting actions. |
| PR Review Culture | Measures the review culture of teams through PR reviews, comments, and approvals. |
| Performance Improvement | Tracks collaboration and contribution diversity to uncover training and coaching needs. |