# Welcome to Oobeya!

Get an overview of Oobeya's features and integrations, and learn how to use them.

## Oobeya Documentation

Set up, configure, and use Oobeya to gain visibility across software delivery, engineering health, quality, resource allocation, and AI-assisted development.

Whether you are onboarding a new workspace, installing Oobeya on-premise, connecting engineering tools, or interpreting your metrics, use the resources below to get started.

***

### Get Started

<table><thead><tr><th width="241.98211669921875">Resource</th><th>Description</th></tr></thead><tbody><tr><td><a href="https://docs.oobeya.io/getting-started/oobeya-quick-onboarding-guide">Quick Onboarding Guide</a></td><td>Connect your tools, add users, create teams, and configure your first Team Scorecard.</td></tr><tr><td><a href="https://docs.oobeya.io/getting-started/product-tour">Product Tour</a></td><td>Explore the main capabilities and workflows available in Oobeya.</td></tr><tr><td><a href="https://docs.oobeya.io/integrations/all-integrations">Integration Catalog</a></td><td>Browse supported SCM, CI/CD, project management, quality, testing, monitoring, identity, and AI coding tools.</td></tr><tr><td><a href="https://docs.oobeya.io/installations/installation-video">On-Premise Installation</a></td><td>Review installation requirements and deployment instructions for self-managed environments.</td></tr></tbody></table>

***

### Explore Oobeya by Goal

<table><thead><tr><th width="466.1234130859375">Goal</th><th>Documentation</th></tr></thead><tbody><tr><td>Understand development activity and code contribution</td><td><a href="https://docs.oobeya.io/gitwiser-repo-analytics/git-analytics-metric-definitions">Development Analytics</a></td></tr><tr><td>Track software delivery performance</td><td><a href="https://docs.oobeya.io/deployment-analytics/dora-metrics-introduction">DORA Metrics</a></td></tr><tr><td>Analyze planning, flow, and delivery predictability</td><td><a href="https://docs.oobeya.io/project-analytics/project-analytics-metric-definitions">Project Analytics</a></td></tr><tr><td>Review team health and engineering performance</td><td><a href="https://docs.oobeya.io/team-health/team-scorecards">Team Scorecards</a></td></tr><tr><td>Detect engineering risks and improvement opportunities</td><td><a href="https://docs.oobeya.io/team-insights-and-symptoms/symptoms-catalog">Symptoms Catalog</a></td></tr><tr><td>Compare results with engineering standards</td><td><a href="https://docs.oobeya.io/team-insights-and-symptoms/engineering-benchmarks">Engineering Benchmarks</a></td></tr><tr><td>Understand the impact of AI coding assistants</td><td><a href="https://docs.oobeya.io/use-cases/measuring-the-impact-of-ai-coding-assistants">AI Coding Assistant Impact</a></td></tr><tr><td>Configure GitHub Copilot analytics</td><td><a href="https://docs.oobeya.io/ai-impact/github-copilot-ai-impact">GitHub Copilot – AI Impact</a></td></tr><tr><td>Understand engineering resource distribution</td><td><a href="https://docs.oobeya.io/allocations/resource-allocation">Resource Allocation</a></td></tr><tr><td>Analyze bugs and defect trends</td><td><a href="https://docs.oobeya.io/bug-report/bug-report-dashboard">Bug Report</a></td></tr></tbody></table>

***

### Configure Your Workspace

#### Integrations

Connect Oobeya to your engineering toolchain to create a unified view of software development and delivery.

* [Browse the Integration Catalog](https://docs.oobeya.io/integrations/all-integrations)
* [Learn how to add a new integration](https://docs.oobeya.io/integrations/adding-new-integration)

#### Users, Teams, and Access

Configure your organization structure, authentication settings, users, teams, and scorecards.

* [User Management, SSO, and Authentication](https://docs.oobeya.io/administration/user-management-single-sign-on-auth-settings)
* [Create and Configure a Team Scorecard](https://docs.oobeya.io/team-health/team-scorecards)

***

### What Is Oobeya?

Oobeya is an AI-powered Software Engineering Intelligence platform that brings together data from source code management, CI/CD, project management, code quality, testing, monitoring, identity, and AI coding tools.

It helps engineering organizations understand delivery performance, code quality, team health, resource allocation, engineering risks, and the impact of AI-assisted development.

Oobeya provides visibility at the organization, team, project, repository, and individual levels—helping engineering leaders move from fragmented metrics to actionable insights.

***

### How Oobeya Works

1. **Connect your engineering tools**

   Integrate your SCM, CI/CD, project management, code quality, testing, monitoring, and AI coding platforms.
2. **Configure your organization**

   Add users, map accounts, define teams, assign repositories, and configure access permissions.
3. **Analyze engineering activity**

   Oobeya collects and transforms engineering data into standardized metrics, scorecards, trends, benchmarks, and insights.
4. **Identify risks and opportunities**

   Use Team Scorecards, engineering Symptoms, AI Impact reports, dashboards, and detailed analytics to understand where attention is needed.
5. **Track improvement over time**

   Compare teams, review trends, monitor goals, and evaluate how engineering practices and AI-assisted workflows affect delivery outcomes.

***

### Popular References

* [Metrics List](https://docs.oobeya.io/getting-started/metrics)
* [Symptoms Catalog](https://docs.oobeya.io/team-insights-and-symptoms/symptoms-catalog)
* [Engineering Benchmarks](https://docs.oobeya.io/team-insights-and-symptoms/engineering-benchmarks)
* [Oobeya REST API](https://docs.oobeya.io/api-reference/oobeya-rest-api)

***

### Need Help?

Contact the support resources dedicated to your organization if you experience a technical or configuration issue.

For product information, customer stories, and additional resources, visit [oobeya.io](https://oobeya.io/).

***

### Start with Oobeya

Follow the [Quick Onboarding Guide](https://docs.oobeya.io/getting-started/oobeya-quick-onboarding-guide) to connect your first engineering tool, configure your teams, and create your first engineering view.


# Oobeya Quick Onboarding Guide

Welcome to Oobeya! We're excited to have you on board. This step-by-step guide will help you quickly get started.

## Quick Onboarding Guide

Use this guide to connect your engineering tools, configure your organization, and create your first actionable engineering view in Oobeya.

This guide is primarily intended for Oobeya **Workspace Administrators** responsible for the initial configuration of Oobeya.

***

### Before You Begin

Make sure that:

* Your Oobeya workspace is available.
* You have administrator access to Oobeya.
* You have the required credentials or tokens for the tools you plan to connect.
* The service account used to generate tokens has access to the required repositories, projects, pipelines, and boards.
* Your organization has identified the first teams and repositories to onboard.

> Start with a small, representative scope. Configure one or two teams first, validate the results, and then expand the setup across the organization.

***

### Onboarding Overview

The recommended onboarding sequence is:

1. Define the initial scope
2. Connect your source code management platform
3. Initialize Development Analytics
4. Connect additional engineering tools
5. Add users and map identities
6. Create teams
7. Configure Team Scorecards
8. Initialize Project Analytics
9. Validate data and automate updates
10. Expand your Oobeya setup

***

### Step 1: Define Your Initial Scope

Before connecting tools, define what you want to onboard first.

For the initial setup, identify:

* One or two engineering teams
* The repositories owned by those teams
* The primary development branches
* The related project management boards
* The CI/CD pipelines used for production deployments
* The users who will access Oobeya
* The contributors who will be analyzed by Oobeya

Also decide which outcomes you want to review first:

* Development activity and productivity metrics
* Pull request and code review performance
* DORA metrics
* Project delivery and flow
* Code quality
* Team health and engineering risks
* AI coding assistant adoption and impact

A clearly defined scope makes it easier to validate data, repository ownership, team mapping, and metric accuracy.

***

### Step 2: Connect Your Source Code Management Platform

Oobeya uses source code management data as the foundation for Development Analytics.

Commonly supported SCM platforms include:

* GitHub, GitLab, Azure DevOps, Bitbucket, Gitea, Gerrit.

#### 2.1 Install the Add-on

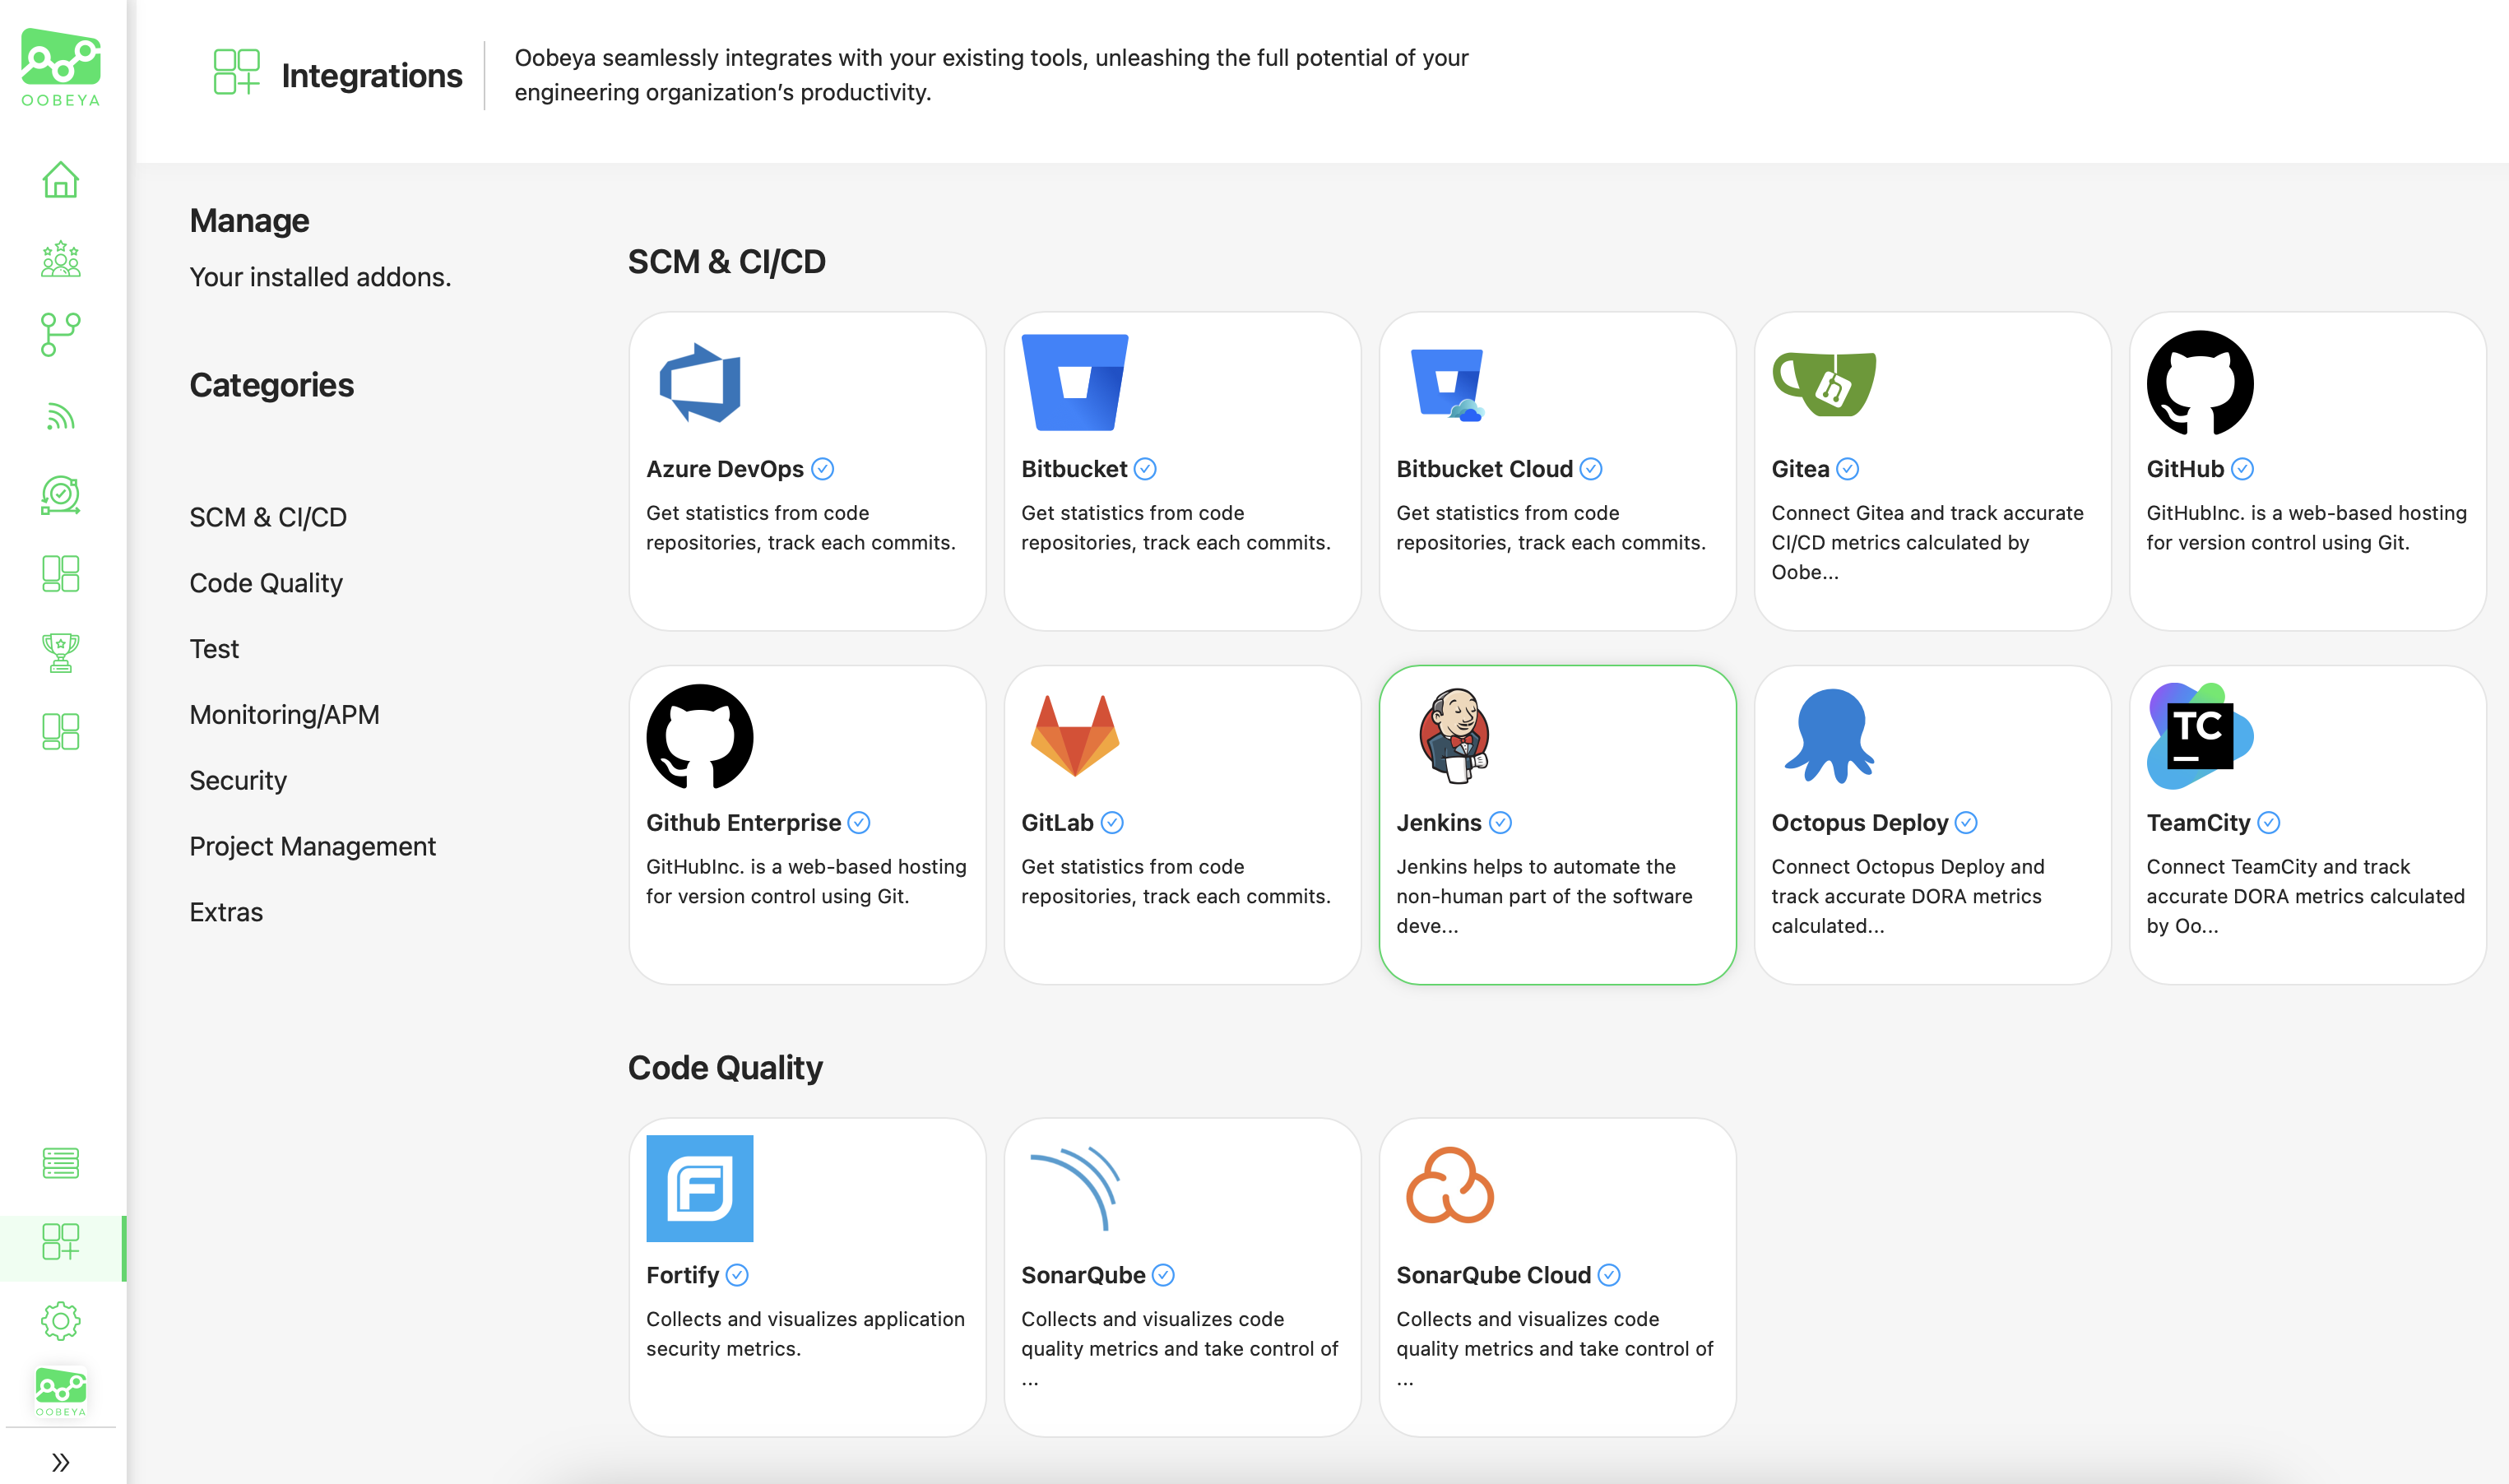
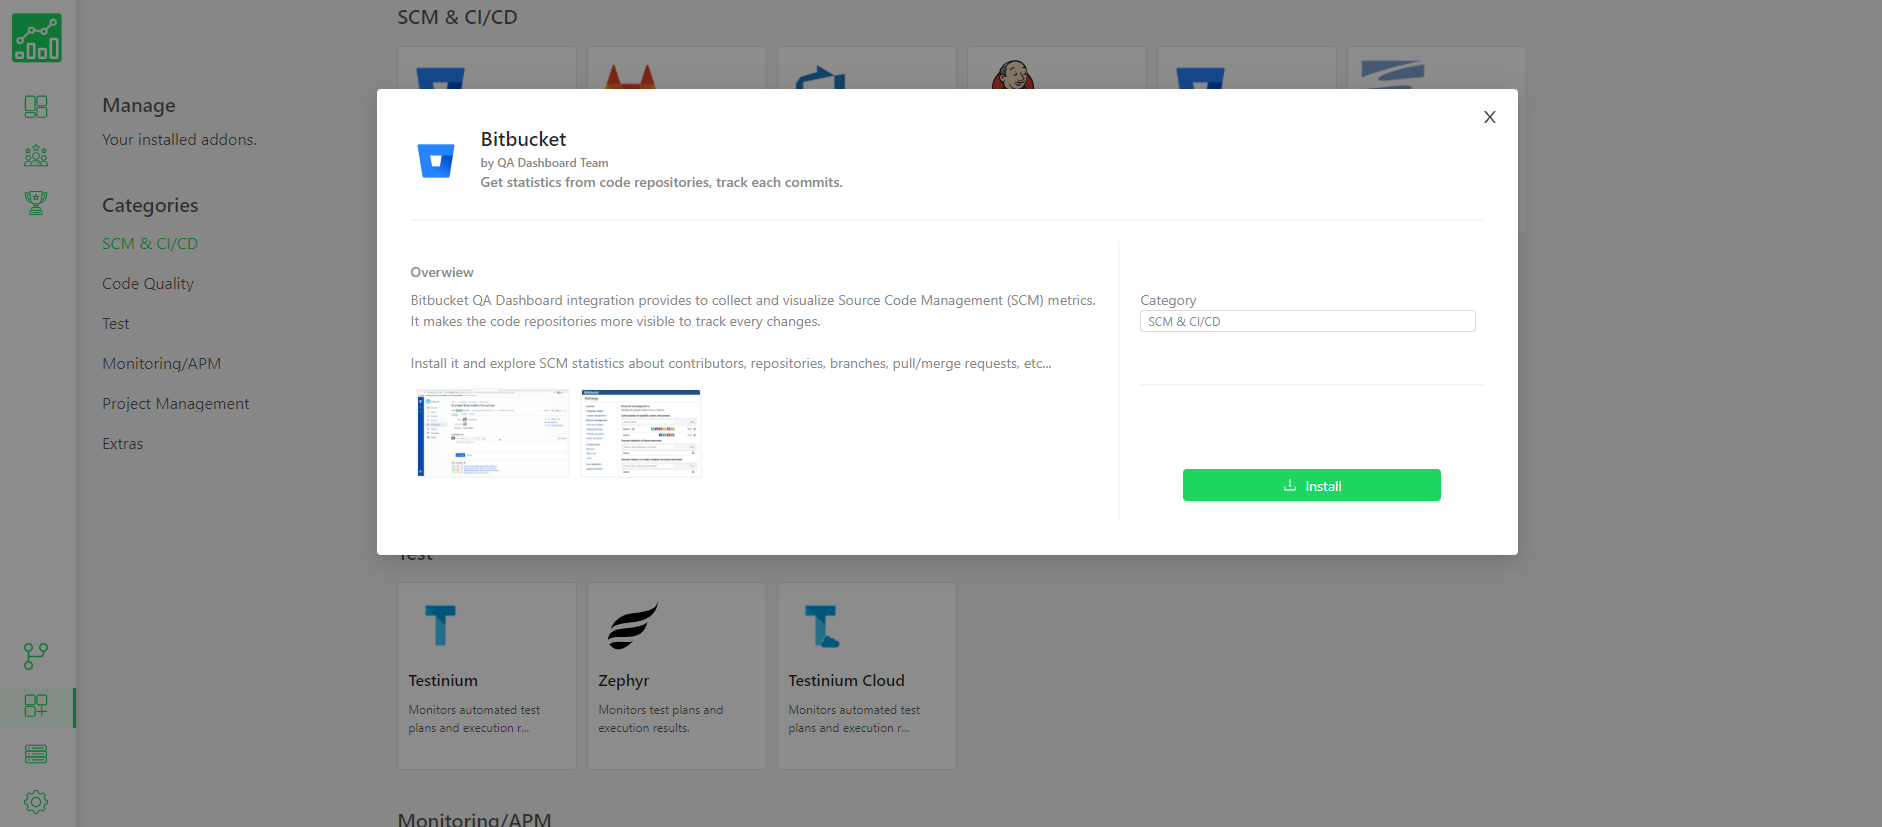
1. Open **Integrations** in Oobeya.
2. Find your SCM platform.
3. Select the add-on.
4. Click **Install**.

See [Installing an Add-on](https://docs.oobeya.io/integrations/adding-new-integration/installing-an-addon).

#### 2.2 Add a Data Source

After installing the add-on:

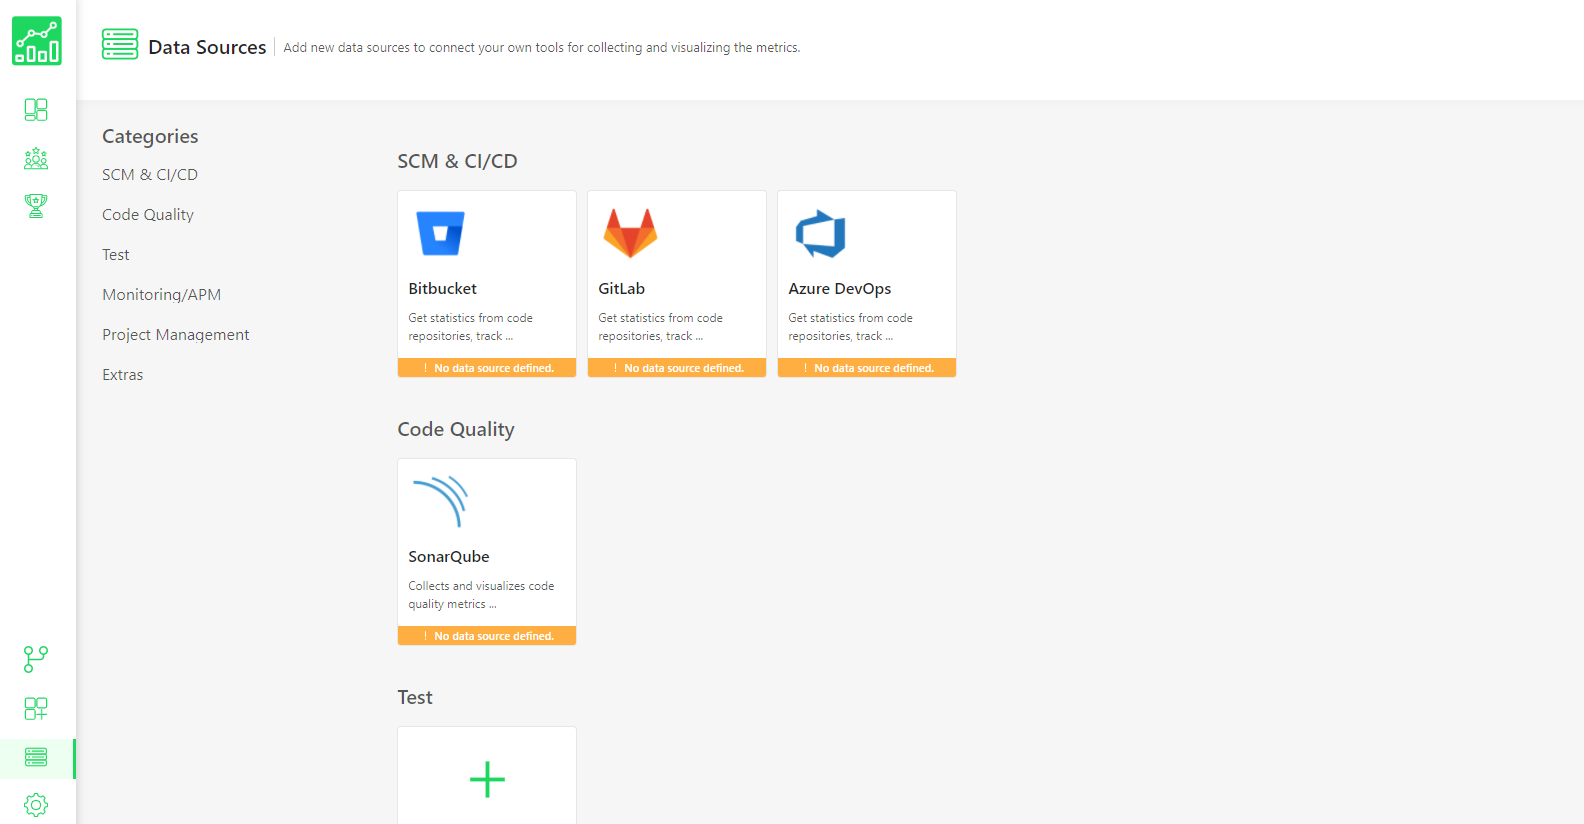
1. Navigate to **Data Sources**.
2. Select the installed SCM platform.
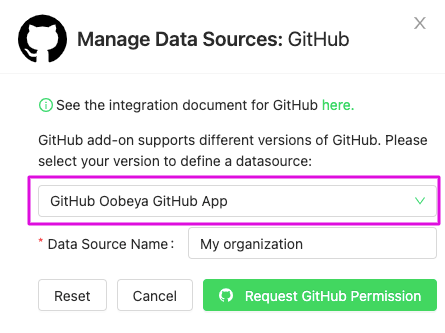
3. Click **New Data Source**.
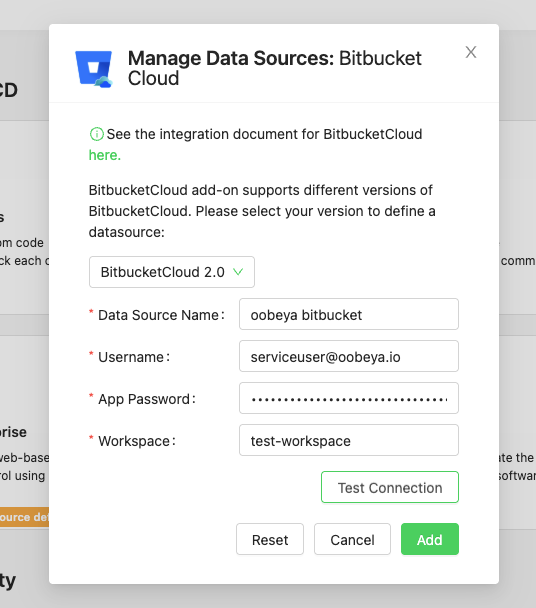
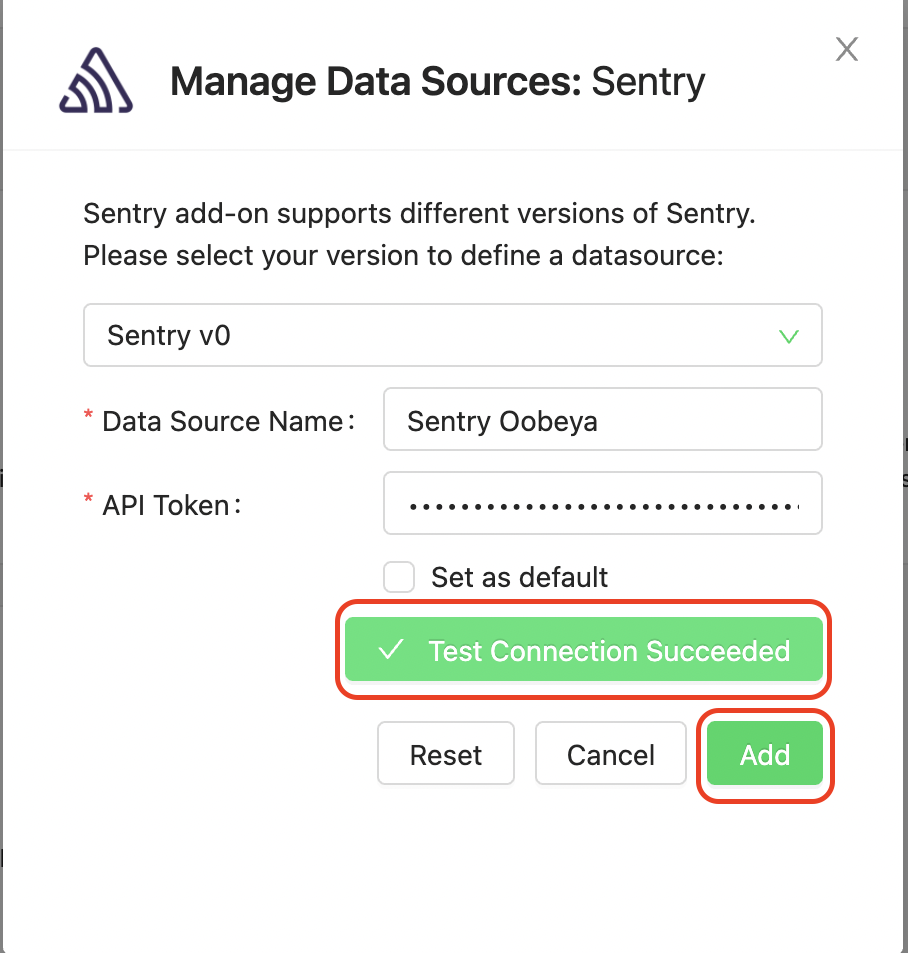
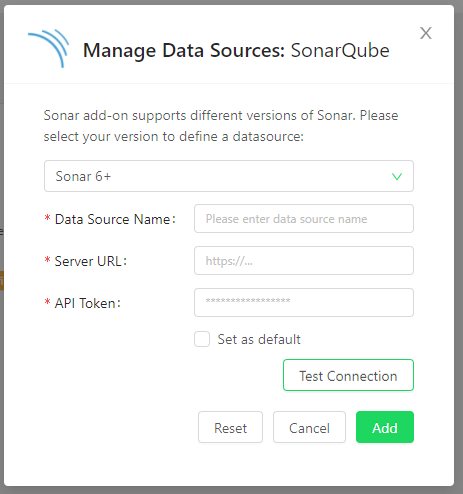
4. Enter the required URL, credentials, token, or connection details.
5. Save the data source.
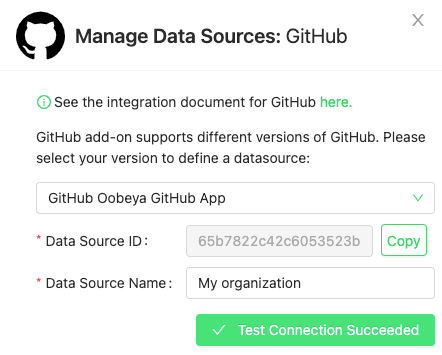
6. Validate that Oobeya can access the expected organizations, projects, and repositories.

See [Adding a New Data Source](https://docs.oobeya.io/integrations/adding-new-integration/adding-a-new-data-source).

For provider-specific requirements and permission details, review the [Integration Catalog](https://docs.oobeya.io/integrations/all-integrations).

> The connected service account must be able to access every repository and project that you want to analyze.

***

### Step 3: Initialize Development Analytics

After connecting your SCM platform, create your first Development Analytics analysis.

Development Analytics can analyze:

* Commits
* Contributors
* Branches
* Pull requests
* Code review activity
* Development patterns
* Deployment activity
* DORA metrics

To start an analysis:

1. Open **Development Analytics**.
2. Click **New Analysis**.
3. Select your SCM platform and data source.
4. Select the project, repository, and branch.
5. Choose the CI/CD strategy used by the repository.
6. Configure deployment and incident detection options when applicable.
7. Select the related team and historical analysis period.
8. Review the configuration and click **Finish**.

See [Setting Up Development Analytics and DORA Metrics](https://docs.oobeya.io/gitwiser-repo-analytics/settings-for-git-analytics/initialize-development-analytics).

#### Configuration Notes

* Select the correct primary or development branch.
* Choose the CI/CD strategy that reflects the actual delivery workflow.
* Configure the production deployment pipeline when you want to calculate deployment metrics.
* Select the correct development model, such as pull request-based or trunk-based development.
* Configure an incident source to calculate Change Failure Rate and Time to Restore Service accurately.
* Avoid starting with every repository before validating the configuration on a smaller scope.

The initial historical analysis may take some time depending on the selected date range, repository size, and number of activities.

***

### Step 4: Connect Additional Engineering Tools

While the initial repository analysis is running, connect the other tools used across your software delivery lifecycle.

Depending on your reporting goals, you can connect:

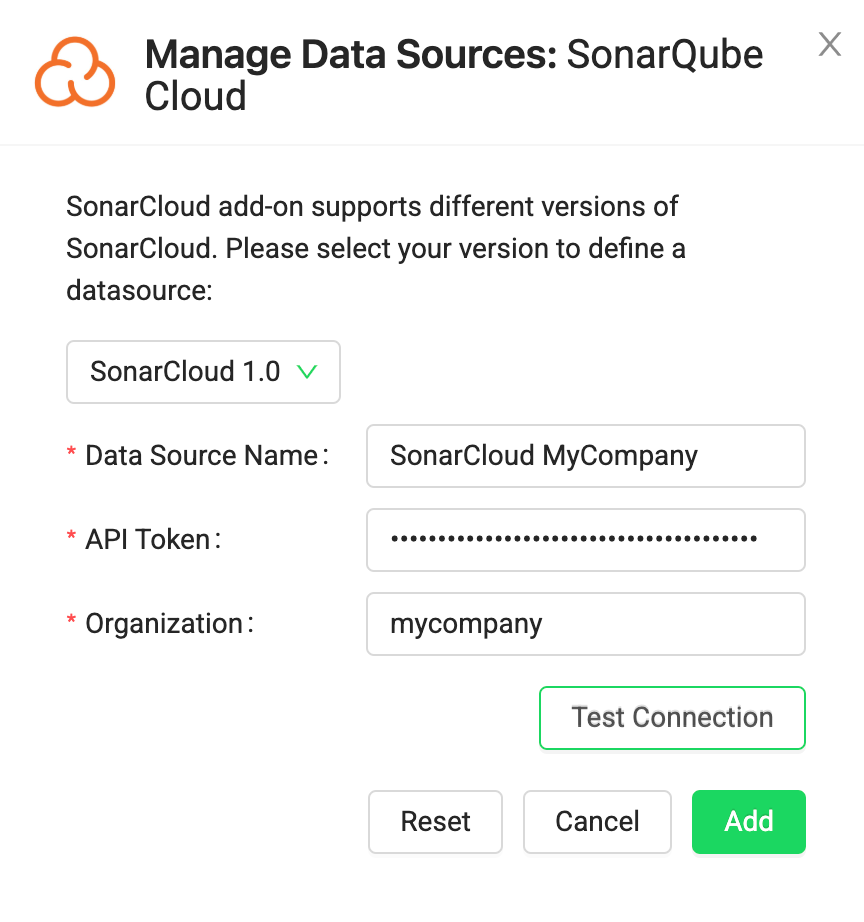
<table><thead><tr><th width="186.2650146484375">Data Source</th><th width="246.2806396484375">Examples</th><th>What It Adds</th></tr></thead><tbody><tr><td>Project management</td><td>Jira, Azure Boards, ServiceNow</td><td>Work items, flow, predictability, lead time, cycle time</td></tr><tr><td>CI/CD</td><td>ArgoCD, Jenkins, GitHub Actions, GitLab CI, Azure Pipelines</td><td>Build, pipeline, and deployment activity</td></tr><tr><td>Code quality and security</td><td>SonarQube, SonarCloud, Fortify</td><td>Quality, security, maintainability, and technical debt signals</td></tr><tr><td>Monitoring and APM</td><td>New Relic, Dynatrace, Datadog, Elastic</td><td>Production incidents and operational signals</td></tr><tr><td>Test management</td><td>Xray, Testinium and supported testing tools</td><td>Test execution, automation, and efficiency signals</td></tr><tr><td>AI coding assistants</td><td>GitHub Copilot and supported AI tools</td><td>Adoption, usage, cost, and engineering impact signals</td></tr><tr><td>Identity providers</td><td>Microsoft Entra ID, LDAP, Active Directory</td><td>Authentication, provisioning, and user onboarding</td></tr></tbody></table>

Browse all available tools in the [Integration Catalog](https://docs.oobeya.io/integrations/all-integrations).

> Connect only the tools required for your initial use case. Additional integrations can be introduced after the first teams and metrics are validated.

***

### Step 5: Add Users and Map Identities

Users must be configured correctly so that Oobeya can associate engineering activity with the correct profiles and teams.

You can add users through:

#### Microsoft Entra ID

Configure authentication and user access through Microsoft Entra ID.

See [Microsoft Entra ID Integration](https://docs.oobeya.io/administration/user-management-single-sign-on-auth-settings/azure-ad-integration).

#### LDAP or Active Directory

Connect your corporate directory to authenticate and import users.

See [LDAP / Active Directory Integration](https://docs.oobeya.io/administration/user-management-single-sign-on-auth-settings/configuring-ldap-active-directory).

#### Manual User Creation

Create individual users directly in Oobeya.

See [Adding a New User](https://docs.oobeya.io/administration/user-management-single-sign-on-auth-settings/adding-a-new-user).

#### Verify Contributor Accounts

A single developer may appear under different usernames or email addresses across Git, project management, code quality, and identity systems.

Review contributor identities and merge duplicate accounts where necessary. Correct identity mapping is especially important for:

* Developer Profiles
* Team Scorecards
* Resource Allocation
* AI Impact
* Individual-level metrics
* Cross-platform reporting

***

### Step 6: Create Your Teams

Teams connect people, repositories, projects, and engineering metrics within Oobeya.

To create a team:

1. Open the team management area.
2. Click **Add Team**.
3. Enter the team name and description.
4. Add team members.
5. Assign the relevant team roles.
6. Save the team.

See [Adding a Team](https://docs.oobeya.io/team-health/adding-a-team).

#### Team Configuration Checklist

Before continuing, verify that:

* All current team members are included.
* Former team members are removed or marked correctly.
* Contributor identities are mapped to the correct users.
* The correct repositories are associated with the team.
* The correct project boards are associated with the team.
* Team ownership reflects the selected reporting period.

> Team configuration affects scorecards, Symptoms, resource allocation, benchmarks, and team-level reporting. Review team membership regularly.

***

### Step 7: Configure the Team Scorecard

Team Scorecards provide a unified view of engineering health by combining metrics from multiple data sources.

To configure the first scorecard:

1. Open the team.
2. Navigate to **Team Scorecard**.
3. Add the relevant scorecard widgets.
4. Select the required repositories, projects, and data sources.
5. Configure targets and benchmarks where applicable.
6. Save the scorecard.
7. Validate the results with the team or engineering manager.

See [Team Scorecard](https://docs.oobeya.io/team-health/team-scorecards).

A first scorecard can include signals from:

* Development Analytics
* Pull Request Analytics
* DORA metrics
* Project Analytics
* Code Quality
* Test Analytics
* Bug Analytics
* AI Impact
* Engineering Symptoms

Start with a small number of meaningful metrics rather than displaying every available metric.

***

### Step 8: Initialize Project Analytics

Connect a project management platform when you want to analyze delivery flow, work item progress, planning effectiveness, and predictability.

Project Analytics can provide visibility into:

* Lead Time
* Cycle Time
* Velocity
* Throughput
* Predictability
* Productivity
* Work in Progress
* Backlog Health
* Innovation Rate
* Project Contribution

To start an analysis:

1. Connect Jira, Azure Boards, or another supported project management platform.
2. Open **Project Analytics**.
3. Click **New Analysis**.
4. Select the data source, project, and board.
5. Configure work item types, workflow statuses, and analysis settings.
6. Associate the analysis with the relevant team.
7. Select the historical analysis period.
8. Review the configuration and start the analysis.

See [Starting a Project Analytics Analysis](https://docs.oobeya.io/project-analytics/project-analytics/starting-an-agile-board-analysis).

> Review status mappings and excluded work item types carefully. Incorrect workflow configuration can affect flow and delivery metrics.

***

### Step 9: Validate Your Data

Before expanding Oobeya across the organization, validate the first results with the relevant engineering teams.

#### Development Analytics

Confirm that:

* [ ] The expected repositories are visible.
* [ ] The correct branches are analyzed.
* [ ] Commit authors are mapped correctly.
* [ ] Pull requests and reviews are visible.
* [ ] Bot accounts and service users are handled appropriately.
* [ ] Outlier or irrelevant commits are excluded when necessary.

#### DORA Metrics

Confirm that:

* [ ] The correct production pipeline is selected.
* [ ] Deployments are detected correctly.
* [ ] The development model matches the team workflow.
* [ ] Production failures are detected from the correct source.
* [ ] Deployment environments are mapped correctly.

#### Project Analytics

Confirm that:

* [ ] The correct project and board are selected.
* [ ] Workflow statuses are mapped correctly.
* [ ] Completed, active, and backlog states are classified correctly.
* [ ] Unnecessary work item types are excluded.
* [ ] Team and project relationships are accurate.

#### Teams and Users

Confirm that:

* [ ] Team membership is current.
* [ ] Duplicate contributor profiles are merged.
* [ ] Repositories and boards are assigned to the correct teams.
* [ ] Access permissions match user responsibilities.

Data validation should involve both the Oobeya administrator and the engineering teams that understand the actual workflows.

***

### Step 10: Configure Automatic Updates

After validating the first analyses, configure automatic reanalysis so that Oobeya keeps engineering data up to date.

See [Setting Automated Reanalyze for Development Analytics](https://docs.oobeya.io/gitwiser-repo-analytics/settings-for-git-analytics/setting-automated-reanalyze-for-gitwiser).

When selecting an update frequency, consider:

* The size of the organization
* The number of repositories and boards
* The frequency of engineering activity
* Available infrastructure resources
* Reporting and operating review schedules

For on-premise environments, monitor resource consumption as the number of integrations and analyses increases.

***

### Step 11: Expand Your Oobeya Setup

After the initial teams and data sources are validated, you can gradually enable additional Oobeya capabilities.

#### Engineering Insights and Symptoms

Automatically identify recurring bottlenecks, risks, and engineering anti-patterns.

* [Symptoms Catalog](https://docs.oobeya.io/team-insights-and-symptoms/symptoms-catalog)
* [Engineering Benchmarks](https://docs.oobeya.io/team-insights-and-symptoms/engineering-benchmarks)

#### AI Coding Assistant Impact

Understand AI coding assistant adoption and its relationship with engineering outcomes.

* [Measuring the Impact of AI Coding Assistants](https://docs.oobeya.io/use-cases/measuring-the-impact-of-ai-coding-assistants)
* [GitHub Copilot – AI Impact](https://docs.oobeya.io/ai-impact/github-copilot-ai-impact)
* [AI Cost and Credits](/ai-impact/ai-cost-and-credits)

#### Resource Allocation

Understand how engineering capacity is distributed across projects and work categories.

* [Resource Allocation](https://docs.oobeya.io/allocations/resource-allocation)

***

### Recommended Rollout Approach

For enterprise onboarding, use an incremental rollout:

#### Phase 1: Pilot

* [ ] Select one or two representative teams.
* [ ] Connect the minimum required tools.
* [ ] Validate identities, repositories, boards, and pipelines.
* [ ] Create the first Team Scorecards.
* [ ] Review results with engineering managers.

#### Phase 2: Standardize

* [ ] Define common repository and project configuration standards.
* [ ] Establish consistent team ownership and identity mapping.
* [ ] Agree on the core metrics and scorecard structure.
* [ ] Document exceptions for different engineering workflows.

#### Phase 3: Scale

* [ ] Onboard additional teams and business units.
* [ ] Introduce additional integrations and modules.
* [ ] Create organization-level dashboards.
* [ ] Configure role-based access.
* [ ] Establish recurring engineering reviews.

#### Phase 4: Improve

* [ ] Review engineering Symptoms and trends.
* [ ] Compare teams using relevant benchmarks and context.
* [ ] Track improvement goals over time.
* [ ] Evaluate the impact of process, tooling, and AI-assisted development changes.

***

### Onboarding Completion Checklist

Use this checklist before completing the initial onboarding:

* [ ] Oobeya is installed or the SaaS workspace is accessible.
* [ ] The primary SCM platform is connected.
* [ ] At least two repository analysis is completed.
* [ ] Repository, branch, and contributor data is validated.
* [ ] Required CI/CD, project management, quality, and monitoring tools are connected.
* [ ] Users are added or imported.
* [ ] Duplicate contributor identities are reviewed.
* [ ] At least two teams are created.
* [ ] Team members, repositories, and boards are mapped correctly.
* [ ] The first Team Scorecard is configured.
* [ ] Project Analytics is initialized where applicable.
* [ ] DORA configuration is validated where applicable.
* [ ] Automatic reanalysis is enabled.
* [ ] Access permissions are reviewed.
* [ ] Engineering managers have validated the initial results.

***

### Next Steps

After completing the onboarding process:

* Review the [Metrics List](https://docs.oobeya.io/getting-started/metrics).
* Review the [Symptoms Catalog](https://docs.oobeya.io/team-insights-and-symptoms/symptoms-catalog).
* Establish a recurring review process for team health, delivery, quality, and AI impact.

***

### Need Help?

The Oobeya team is dedicated to ensuring a smooth onboarding experience. If you have any questions or feedback, reach out to us on our [website](https://oobeya.io/contact/) or via your dedicated support channels.


# Metrics List

View a comprehensive list of the metrics in Oobeya, which is organised into different categories for your convenience.

## Oobeya Metrics List

This page provides a module-by-module reference for the metrics, scores, distributions, and analytical indicators avaier permissions

* Team, repository, project, and data-source mappings
* Selected date range
* Organization-specific configuration

> Oobeya metrics should be interpreted together and within the context of each team. A single metric should not be used as an individual performance target.

***

### Metrics by Module

* [Development Analytics](#development-analytics)
* [Pull Request Analytics](#pull-request-analytics)
* [Delivery Analytics and DORA Metrics](#delivery-analytics-and-dora-metrics)
* [Project Analytics](#project-analytics)
* [Code Quality Analytics](#code-quality-analytics)
* [Application Performance Metrics](#application-performance-metrics)
* [Test Analytics](#test-analytics)
* [AI Coding Assistant Impact](#ai-coding-assistant-impact)
* [AI Cost and Credits](#ai-cost-and-credits)
* [Document Analytics for Confluence](#document-analytics-for-confluence)
* [Resource Allocation](#resource-allocation)
* [Bug Report](#bug-report)
* [Activity Heatmap](#activity-heatmap)
* [Gamification](#gamification)
* [Team Scorecards, Developer Profiles, and Dashboards](#team-scorecards-developer-profiles-and-dashboards)
* [Engineering Insights and Symptoms](#engineering-insights-and-symptoms)

***

## Development Analytics

Development Analytics uses source code management data to analyze engineering activity, contribution patterns, code changes, work types, and development behavior.

Supported data sources include GitHub, GitLab, Azure DevOps, Bitbucket, and Gitea.

For detailed configuration and calculation information, see [Git Analytics – Metric Definitions](https://docs.oobeya.io/gitwiser-repo-analytics/git-analytics-metric-definitions).

### Engineering Efficiency and Impact

<table><thead><tr><th width="261.29095458984375">Metric</th><th>Definition</th></tr></thead><tbody><tr><td><strong>Coding Efficiency (%)</strong></td><td>The percentage of analyzed code changes classified as productive work rather than short-term rework or Code Churn.</td></tr><tr><td><strong>Coding Impact Score</strong></td><td>A configurable score representing the scope and approximate cognitive impact of code changes. It considers files added, modified, or deleted; Git hunks; and lines added, edited, or deleted.</td></tr><tr><td><strong>Impact Ratio</strong></td><td>Shows how Coding Impact is distributed among contributors within a team. It helps identify concentrated ownership, knowledge silos, and workload imbalance.</td></tr><tr><td><strong>Coding Impact per Developer</strong></td><td>The Coding Impact Score attributed to each developer during the selected period.</td></tr><tr><td><strong>Rework Rate (%)</strong></td><td>The percentage of analyzed development activity classified as Code Churn or short-term rework.</td></tr><tr><td><strong>Coding Impact Trend</strong></td><td>The change in Coding Impact Score over the selected period.</td></tr><tr><td><strong>Coding Efficiency Trend</strong></td><td>The change in Coding Efficiency over time.</td></tr></tbody></table>

Learn more about [Coding Impact Score](https://docs.oobeya.io/gitwiser-repo-analytics/git-analytics-metric-definitions/coding-impact-score) and [Impact Ratio](https://docs.oobeya.io/gitwiser-repo-analytics/git-analytics-metric-definitions/impact-ratio-team-level).

### Work Type Metrics

<table><thead><tr><th width="254.81317138671875">Metric</th><th>Definition</th></tr></thead><tbody><tr><td><strong>New Work</strong></td><td>Newly written code lines.</td></tr><tr><td><strong>Refactor</strong></td><td>Changes made to existing code after the configured aging period. The default aging period is 21 days.</td></tr><tr><td><strong>Help Others</strong></td><td>Changes made by a developer to another developer’s recent work.</td></tr><tr><td><strong>Code Churn / Rework</strong></td><td>Code rewritten or deleted by the same developer shortly after it was originally written. The default period is 21 days.</td></tr><tr><td><strong>New Work Rate (%)</strong></td><td>Percentage of analyzed code changes classified as New Work.</td></tr><tr><td><strong>Refactor Rate (%)</strong></td><td>Percentage of analyzed code changes classified as Refactor.</td></tr><tr><td><strong>Help Others Rate (%)</strong></td><td>Percentage of analyzed code changes classified as Help Others.</td></tr><tr><td><strong>Code Churn Rate (%)</strong></td><td>Percentage of analyzed code changes classified as Code Churn.</td></tr><tr><td><strong>Work Type Distribution</strong></td><td>Distribution of New Work, Refactor, Help Others, and Code Churn within the selected period.</td></tr></tbody></table>

### Development Activity Metrics

<table><thead><tr><th width="285.24676513671875">Metric</th><th>Definition</th></tr></thead><tbody><tr><td><strong>Total Commits</strong></td><td>Total number of commits during the selected period.</td></tr><tr><td><strong>Active Coding Days</strong></td><td>Number of days with at least one commit or coding activity.</td></tr><tr><td><strong>Coding Days per Week</strong></td><td>Average number of active coding days per week.</td></tr><tr><td><strong>Active Contributors</strong></td><td>Number of contributors with development activity during the configured activity period.</td></tr><tr><td><strong>Commits per Contributor</strong></td><td>Average number of commits per active contributor.</td></tr><tr><td><strong>Development Activities</strong></td><td>Total development activities included in the selected scope and period.</td></tr><tr><td><strong>Contributor Activity Distribution</strong></td><td>Distribution of development activity among contributors.</td></tr><tr><td><strong>Repository Contribution Distribution</strong></td><td>Distribution of development contributions across repositories.</td></tr><tr><td><strong>Contribution by Repository</strong></td><td>Contribution attributed to each repository.</td></tr><tr><td><strong>Contribution by Team</strong></td><td>Contribution attributed to each mapped team.</td></tr><tr><td><strong>Contribution by Developer</strong></td><td>Contribution attributed to each developer profile.</td></tr></tbody></table>

### Code Change Metrics

<table><thead><tr><th width="243.466552734375">Metric</th><th>Definition</th></tr></thead><tbody><tr><td><strong>Lines Added</strong></td><td>Number of code lines added.</td></tr><tr><td><strong>Lines Deleted</strong></td><td>Number of code lines deleted.</td></tr><tr><td><strong>Lines Edited</strong></td><td>Number of existing code lines modified.</td></tr><tr><td><strong>Total Code Changes</strong></td><td>Total number of added, deleted, and edited code lines.</td></tr><tr><td><strong>Files Added</strong></td><td>Number of new files added to the repository.</td></tr><tr><td><strong>Files Modified</strong></td><td>Number of existing files modified.</td></tr><tr><td><strong>Files Deleted</strong></td><td>Number of files deleted.</td></tr><tr><td><strong>Files Touched</strong></td><td>Total number of unique files affected by development activity.</td></tr><tr><td><strong>Git Hunks</strong></td><td>Number of separate change blocks within the modified files.</td></tr><tr><td><strong>Average Change Size</strong></td><td>Average size of the analyzed commits or development changes.</td></tr><tr><td><strong>Change Size Distribution</strong></td><td>Distribution of development activities by change size.</td></tr><tr><td><strong>File Statistics</strong></td><td>Summary of files added, modified, deleted, or touched.</td></tr><tr><td><strong>Language Distribution</strong></td><td>Distribution of code changes by programming language.</td></tr></tbody></table>

> Commit count and lines of code should not be treated as direct productivity measures. Use Coding Impact, Coding Efficiency, work type, quality, and delivery metrics together.

***

## Pull Request Analytics

Pull Request Analytics helps teams understand review responsiveness, collaboration, flow efficiency, pull request size, and review risks.

### Pull Request Volume

<table><thead><tr><th width="278.0870361328125">Metric</th><th>Definition</th></tr></thead><tbody><tr><td><strong>Total Pull Requests</strong></td><td>Total number of pull requests included in the selected period.</td></tr><tr><td><strong>Open PRs</strong></td><td>Number of pull requests currently open and awaiting review, approval, or merge.</td></tr><tr><td><strong>Merged PRs</strong></td><td>Number of pull requests successfully merged.</td></tr><tr><td><strong>Closed PRs</strong></td><td>Number of pull requests closed without being merged.</td></tr><tr><td><strong>PRs Created</strong></td><td>Number of pull requests created during the selected period.</td></tr><tr><td><strong>PRs per Contributor</strong></td><td>Average number of pull requests created per active contributor.</td></tr><tr><td><strong>Reviewed PRs</strong></td><td>Number of pull requests reviewed by the selected reviewer, developer, or team.</td></tr><tr><td><strong>Reviewed PRs / Total PRs (%)</strong></td><td>Percentage of pull requests reviewed by the selected reviewer, developer, or team.</td></tr></tbody></table>

### Pull Request Time Metrics

<table><thead><tr><th width="295.94287109375">Metric</th><th>Definition</th></tr></thead><tbody><tr><td><strong>Coding Time</strong></td><td>Time between the first commit and the opening of the pull request.</td></tr><tr><td><strong>Code Review Cycle Time</strong></td><td>Time between the pull request opening and merge.</td></tr><tr><td><strong>Time to Merge</strong></td><td>Time between the first commit and merge.</td></tr><tr><td><strong>Average Review Time</strong></td><td>Average time taken by reviewers to complete a pull request review.</td></tr><tr><td><strong>Coding Time Over Goal (%)</strong></td><td>Percentage of pull requests whose Coding Time exceeds the configured goal.</td></tr><tr><td><strong>Code Review Cycle Time Over Goal (%)</strong></td><td>Percentage of pull requests whose review cycle exceeds the configured goal.</td></tr><tr><td><strong>Time to Merge Over Goal (%)</strong></td><td>Percentage of pull requests whose Time to Merge exceeds the configured goal.</td></tr><tr><td><strong>PRs Merged Within Goal (%)</strong></td><td>Percentage of merged pull requests completed within the configured target time.</td></tr></tbody></table>

### Pull Request Size and Review Metrics

<table><thead><tr><th width="277.56207275390625">Metric</th><th>Definition</th></tr></thead><tbody><tr><td><strong>Pull Request Size</strong></td><td>Total number of lines added, removed, and changed in a pull request.</td></tr><tr><td><strong>Average Pull Request Size</strong></td><td>Average size of pull requests during the selected period.</td></tr><tr><td><strong>Pull Request Size Over Goal (%)</strong></td><td>Percentage of pull requests exceeding the configured size goal.</td></tr><tr><td><strong>Number of PR Reviewers</strong></td><td>Number of reviewers assigned to or participating in pull requests.</td></tr><tr><td><strong>Review Comment Count</strong></td><td>Number of review comments added to pull requests.</td></tr><tr><td><strong>PR Approvals</strong></td><td>Number of pull request approvals.</td></tr><tr><td><strong>PR Needs Work</strong></td><td>Number of pull requests returned for changes.</td></tr><tr><td><strong>PR Revert Rate (%)</strong></td><td>Percentage of merged pull requests whose changes were later reverted.</td></tr></tbody></table>

### Pull Request Risk Indicators

<table><thead><tr><th width="232.456298828125">Metric</th><th>Definition</th></tr></thead><tbody><tr><td><strong>Oversized PRs</strong></td><td>Number of pull requests exceeding the configured size threshold.</td></tr><tr><td><strong>Overdue PRs</strong></td><td>Number of pull requests exceeding the configured completion or review-time threshold.</td></tr><tr><td><strong>Stale PRs</strong></td><td>Number of open pull requests without meaningful activity for the configured period.</td></tr><tr><td><strong>Pull Request Risks</strong></td><td>Combined count of Oversized, Overdue, or Stale pull requests.</td></tr><tr><td><strong>PR Risk Distribution</strong></td><td>Distribution of pull requests by identified risk type.</td></tr></tbody></table>

***

## Delivery Analytics and DORA Metrics

Delivery Analytics connects source code management, CI/CD, deployment, and incident data to measure software delivery performance.

See [DORA Metrics Introduction](https://docs.oobeya.io/deployment-analytics/dora-metrics-introduction) and [Deployment Analytics](https://docs.oobeya.io/gitwiser-repo-analytics/deployment-analytics-dora-metrics).

### Four Key DORA Metrics

<table><thead><tr><th width="289.87567138671875">Metric</th><th>Definition</th></tr></thead><tbody><tr><td><strong>Lead Time for Changes</strong></td><td>Time from a code commit or development change until that change is successfully deployed to production.</td></tr><tr><td><strong>Deployment Frequency</strong></td><td>How often the team successfully deploys changes to production.</td></tr><tr><td><strong>Change Failure Rate (%)</strong></td><td>Percentage of production deployments that result in a failure or incident.</td></tr><tr><td><strong>Time to Restore Service / MTTR</strong></td><td>Time required to restore service after a production failure.</td></tr></tbody></table>

### Delivery Flow Metrics

<table><thead><tr><th width="266.318603515625">Metric</th><th>Definition</th></tr></thead><tbody><tr><td><strong>Development Time</strong></td><td>Time between the first commit and merge of the related pull request or change.</td></tr><tr><td><strong>Waiting for Deploy</strong></td><td>Time between the pull request merge and the start of the deployment pipeline.</td></tr><tr><td><strong>Deployment Duration</strong></td><td>Time between the deployment pipeline start and successful completion.</td></tr><tr><td><strong>Lead Time Breakdown</strong></td><td>Breakdown of Lead Time for Changes into development, waiting, and deployment phases.</td></tr><tr><td><strong>Deploy Size</strong></td><td>Number of commits and pull requests included in a deployment package.</td></tr><tr><td><strong>Average Deploy Size</strong></td><td>Average number of commits and pull requests delivered per deployment.</td></tr></tbody></table>

### Deployment and Incident Volume

<table><thead><tr><th width="302.5740966796875">Metric</th><th>Definition</th></tr></thead><tbody><tr><td><strong>Number of Deployments</strong></td><td>Total number of detected successful production deployments.</td></tr><tr><td><strong>Number of Contributors</strong></td><td>Number of contributors whose changes were included in deployments.</td></tr><tr><td><strong>Deployments Leading to an Incident</strong></td><td>Number of deployments associated with a production incident or failure.</td></tr><tr><td><strong>Production Incidents</strong></td><td>Number of incidents included in Change Failure Rate and restoration calculations.</td></tr><tr><td><strong>Successful Deployments</strong></td><td>Number of production deployments completed without a detected failure.</td></tr><tr><td><strong>Failed Changes</strong></td><td>Number of production changes associated with an incident or rollback condition.</td></tr><tr><td><strong>Deployment Frequency Trend</strong></td><td>Change in successful deployment frequency over time.</td></tr><tr><td><strong>Change Failure Rate Trend</strong></td><td>Change in the percentage of failed production changes over time.</td></tr><tr><td><strong>Lead Time Trend</strong></td><td>Change in Lead Time for Changes over time.</td></tr><tr><td><strong>Time to Restore Service Trend</strong></td><td>Change in restoration time over time.</td></tr></tbody></table>

> Change Failure Rate and Time to Restore Service require a correctly configured failure-detection source and production deployment mapping.

***

## Project Analytics

Project Analytics analyzes work items from Jira, Azure Boards, and supported project management systems.

Metrics can be calculated by work-item count, effort, story points, or time estimation depending on the data-source configuration.

See [Project Analytics – Metric Definitions](https://docs.oobeya.io/project-analytics/project-analytics-metric-definitions).

### Board-Level Metrics

<table><thead><tr><th width="281.23956298828125">Metric</th><th>Definition</th></tr></thead><tbody><tr><td><strong>Completed Sprints</strong></td><td>Number of sprints started and completed during the selected period.</td></tr><tr><td><strong>Average Velocity by Effort</strong></td><td>Average amount of estimated effort completed per sprint.</td></tr><tr><td><strong>Average Lead Time</strong></td><td>Average time from work-item creation to completion.</td></tr><tr><td><strong>Average Cycle Time</strong></td><td>Average time from work start to completion.</td></tr><tr><td><strong>Completed Work Items</strong></td><td>Total number of work items completed during the selected period.</td></tr><tr><td><strong>Completed Work Items per Sprint</strong></td><td>Average number of work items completed in each sprint.</td></tr><tr><td><strong>Average Throughput per Week</strong></td><td>Average number of work items completed per working week.</td></tr></tbody></table>

### Flow and Reaction Time Metrics

<table><thead><tr><th width="245.96649169921875">Metric</th><th>Definition</th></tr></thead><tbody><tr><td><strong>Pickup Time</strong></td><td>Initial time between work-item creation and its recognition or placement into a ready backlog or queue.</td></tr><tr><td><strong>Actual Reaction Time</strong></td><td>Time from the configured reference point or ready state until work starts.</td></tr><tr><td><strong>Total Reaction Time</strong></td><td>Pickup Time plus Actual Reaction Time.</td></tr><tr><td><strong>Cycle Time</strong></td><td>Time from when active work begins until the work item is completed.</td></tr><tr><td><strong>Lead Time</strong></td><td>Time from work-item creation until completion.</td></tr><tr><td><strong>Lead Time Breakdown</strong></td><td>Distribution of total Lead Time across reaction, active development, waiting, and configured workflow phases.</td></tr><tr><td><strong>State Cycle Time</strong></td><td>Time spent in each mapped workflow state.</td></tr><tr><td><strong>Time in Status</strong></td><td>Amount of time a work item remains in a specific status.</td></tr><tr><td><strong>Waiting Time</strong></td><td>Time a work item remains idle between active workflow states.</td></tr></tbody></table>

### Sprint Planning Metrics

<table><thead><tr><th width="283.47698974609375">Metric</th><th>Definition</th></tr></thead><tbody><tr><td><strong>Planned</strong></td><td>Number of work items included before the sprint planning cut-off date.</td></tr><tr><td><strong>Planned Effort</strong></td><td>Total estimated effort of work items included before the planning cut-off date.</td></tr><tr><td><strong>Done Planned</strong></td><td>Number of planned work items completed by the end of the sprint.</td></tr><tr><td><strong>Done Planned Effort</strong></td><td>Estimated effort of planned work items completed by the end of the sprint.</td></tr><tr><td><strong>Pulled in Extra</strong></td><td>Number of work items added after the sprint planning cut-off date.</td></tr><tr><td><strong>Effort Pulled in Extra</strong></td><td>Estimated effort of work items added after the planning cut-off date.</td></tr><tr><td><strong>Done Pulled in Extra</strong></td><td>Number of pulled-in work items completed by the end of the sprint.</td></tr><tr><td><strong>Done Pulled in Extra Effort</strong></td><td>Estimated effort of pulled-in work completed by the end of the sprint.</td></tr><tr><td><strong>Unfinished</strong></td><td>Number of work items incomplete at the end of the sprint.</td></tr><tr><td><strong>Unfinished Effort</strong></td><td>Estimated effort of work items incomplete at the end of the sprint.</td></tr><tr><td><strong>Unfinished Planned</strong></td><td>Number of planned work items incomplete at the end of the sprint.</td></tr><tr><td><strong>Unfinished Effort Planned</strong></td><td>Estimated effort of planned work items incomplete at the end of the sprint.</td></tr><tr><td><strong>Unfinished Pulled in Extra</strong></td><td>Number of pulled-in work items incomplete at the end of the sprint.</td></tr><tr><td><strong>Unfinished Effort Pulled in Extra</strong></td><td>Estimated effort of pulled-in work items incomplete at the end of the sprint.</td></tr><tr><td><strong>Dropped</strong></td><td>Number of work items removed from an active sprint after the planning cut-off.</td></tr><tr><td><strong>Effort Dropped</strong></td><td>Estimated effort of work items removed from the sprint.</td></tr><tr><td><strong>End of Sprint</strong></td><td>Total number of completed and incomplete work items at the end of the sprint.</td></tr><tr><td><strong>Effort End of Sprint</strong></td><td>Total estimated effort of completed and incomplete work at the end of the sprint.</td></tr><tr><td><strong>Done</strong></td><td>Total number of work items completed by the end of the sprint.</td></tr><tr><td><strong>Done Effort</strong></td><td>Total estimated effort of completed work items.</td></tr></tbody></table>

### Sprint Performance Metrics

<table><thead><tr><th width="293.3480224609375">Metric</th><th>Definition</th></tr></thead><tbody><tr><td><strong>Sprint Velocity by Count</strong></td><td>Number of work items completed during the sprint.</td></tr><tr><td><strong>Sprint Velocity by Effort</strong></td><td>Total estimated effort completed during the sprint.</td></tr><tr><td><strong>Predictability (%)</strong></td><td>Percentage of originally planned work completed: <code>Done Planned / Planned × 100</code>.</td></tr><tr><td><strong>Productivity (%)</strong></td><td>Total completed planned and extra work relative to the original plan: <code>(Done Planned + Done Pulled in Extra) / Planned × 100</code>.</td></tr><tr><td><strong>Churn (%)</strong></td><td>Percentage of completed work that was pulled into the sprint after planning: <code>Done Pulled in Extra / (Done Planned + Done Pulled in Extra) × 100</code>.</td></tr><tr><td><strong>Sprint Delivery Rate by Count (%)</strong></td><td>Completed work items divided by total work items at the end of the sprint.</td></tr><tr><td><strong>Sprint Delivery Rate by Effort (%)</strong></td><td>Completed effort divided by total effort at the end of the sprint.</td></tr><tr><td><strong>Sprint Planning Accuracy by Count (%)</strong></td><td>Completed work items divided by planned work items.</td></tr><tr><td><strong>Sprint Planning Accuracy by Effort (%)</strong></td><td>Completed effort divided by planned effort.</td></tr><tr><td><strong>Sprint Scope Change</strong></td><td>Amount of work added to or removed from a sprint after the planning cut-off.</td></tr><tr><td><strong>Scope Change Rate (%)</strong></td><td>Relative change in sprint scope after planning.</td></tr></tbody></table>

### Backlog and Kanban Metrics

<table><thead><tr><th width="292.5478515625">Metric</th><th>Definition</th></tr></thead><tbody><tr><td><strong>Backlog Size</strong></td><td>Number of uncompleted work items in the backlog, excluding active work.</td></tr><tr><td><strong>Backlog Age</strong></td><td>Age of the oldest or longest-waiting item in the backlog.</td></tr><tr><td><strong>Average Backlog Age</strong></td><td>Average age of work items currently in the backlog.</td></tr><tr><td><strong>Open Bugs in Backlog</strong></td><td>Number of bug-type work items currently waiting in the backlog.</td></tr><tr><td><strong>Current Backlog Items</strong></td><td>Number of items waiting in a Kanban backlog.</td></tr><tr><td><strong>Work in Progress</strong></td><td>Number of work items currently in active workflow states.</td></tr><tr><td><strong>Work in Progress Over 5 Days</strong></td><td>Work items that have remained in progress for more than five days.</td></tr><tr><td><strong>Throughput</strong></td><td>Number of work items completed during the selected period.</td></tr><tr><td><strong>Average Throughput per Week</strong></td><td>Average number of work items completed per week.</td></tr><tr><td><strong>Reopened Work Items</strong></td><td>Number of work items reopened after completion.</td></tr><tr><td><strong>Work Item Reopen Count</strong></td><td>Total number of reopen events during the selected period.</td></tr></tbody></table>

### Work Mix and Distribution Metrics

<table><thead><tr><th width="299.15478515625">Metric</th><th>Definition</th></tr></thead><tbody><tr><td><strong>Innovation Rate by Count (%)</strong></td><td>Percentage of completed or planned work items classified as innovation or new product work.</td></tr><tr><td><strong>Innovation Rate by Effort (%)</strong></td><td>Percentage of total effort allocated to innovation or new product work.</td></tr><tr><td><strong>Work Item Type Distribution</strong></td><td>Distribution of work by configured work-item type.</td></tr><tr><td><strong>Work Item Priority Distribution</strong></td><td>Distribution of work by priority.</td></tr><tr><td><strong>Work Item Status Distribution</strong></td><td>Distribution of work items across workflow statuses.</td></tr><tr><td><strong>Work Item Category Distribution</strong></td><td>Distribution of work across configured categories such as new work, maintenance, bugs, or support.</td></tr><tr><td><strong>Work Type by Member</strong></td><td>Distribution of project work among team members and work categories.</td></tr><tr><td><strong>Project Contribution</strong></td><td>Distribution of completed work or effort among contributors and teams.</td></tr></tbody></table>

> Planning metrics depend on correct sprint dates, planning cut-off configuration, workflow mapping, effort fields, and excluded work-item types.

***

## Code Quality Analytics

Code Quality Analytics uses SonarQube or SonarCloud data to provide visibility into technical debt, security, reliability, maintainability, and codebase health.

See [Total Code Quality Index](https://docs.oobeya.io/quality-analytics/total-code-quality-index-tcqi).

### Core Quality Metrics

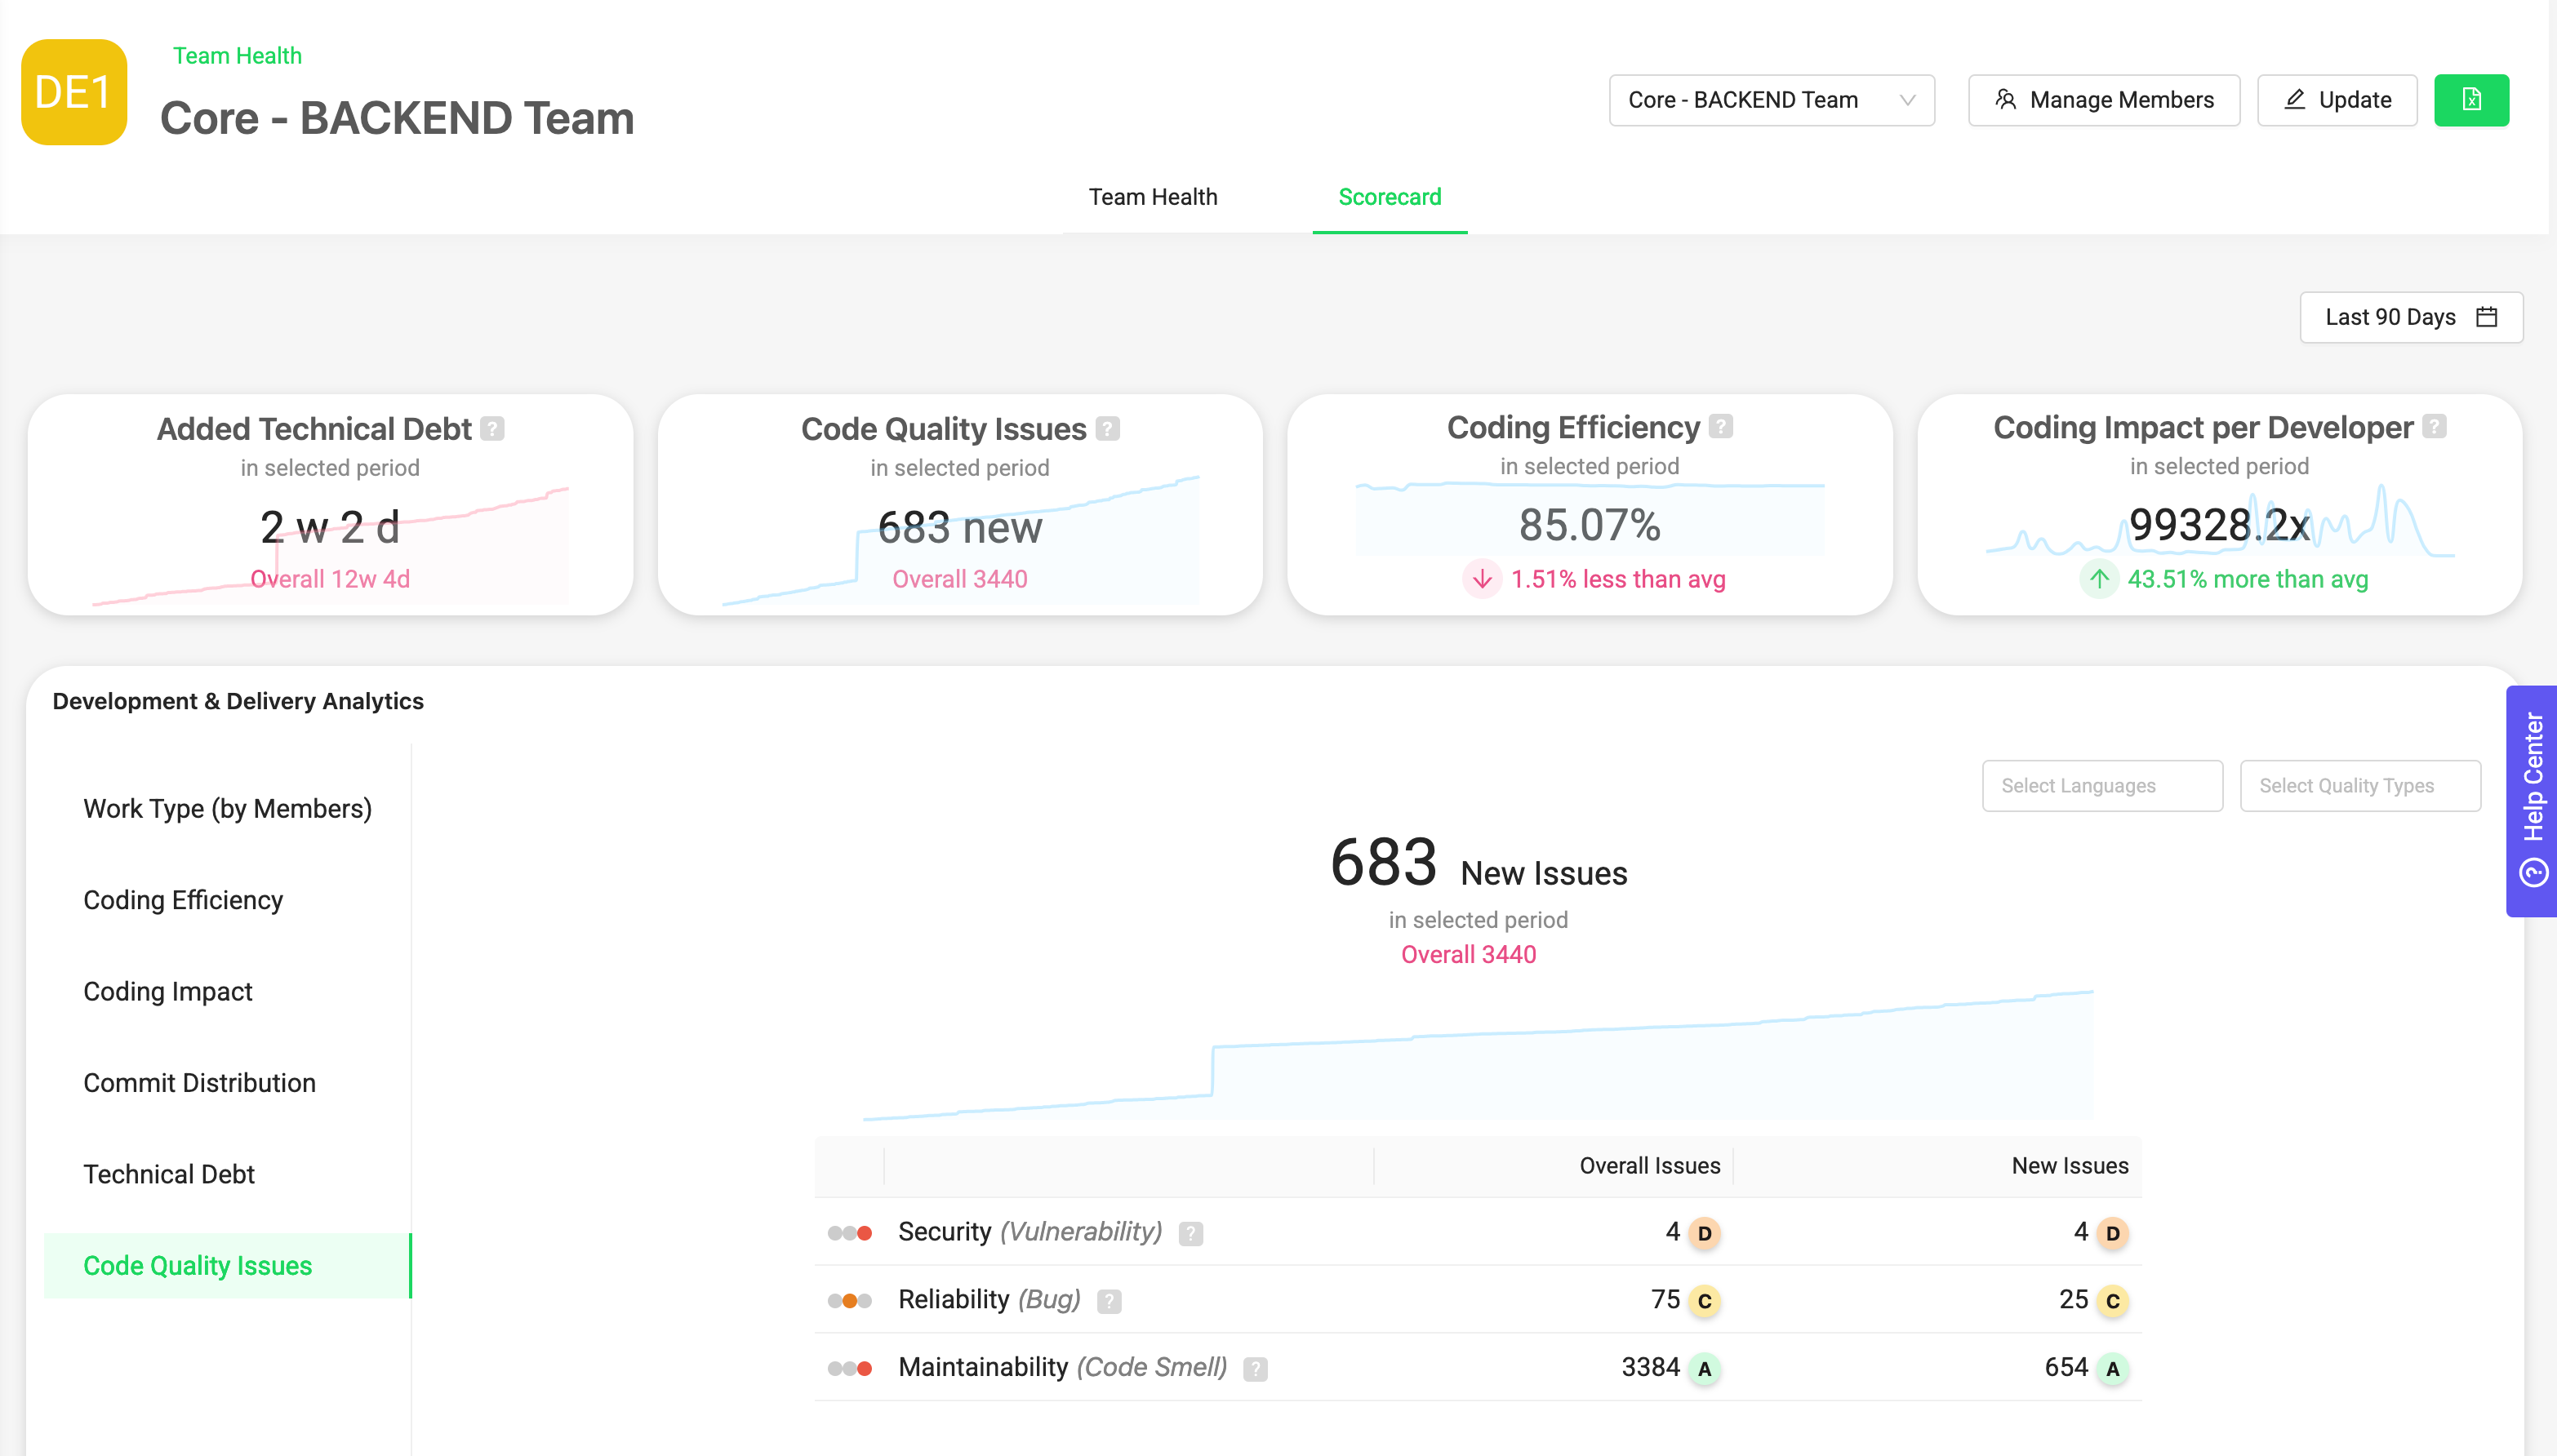
<table><thead><tr><th width="267.99993896484375">Metric</th><th>Definition</th></tr></thead><tbody><tr><td><strong>Technical Debt – Overall</strong></td><td>Estimated remediation time required to fix all maintainability issues in the analyzed codebase.</td></tr><tr><td><strong>Technical Debt – New Period</strong></td><td>Technical debt introduced during the selected period or on new code.</td></tr><tr><td><strong>Technical Debt per Developer</strong></td><td>Technical debt attributed to each developer based on source-control author information.</td></tr><tr><td><strong>Added Technical Debt</strong></td><td>Technical debt introduced during the selected period.</td></tr><tr><td><strong>Code Quality Issues</strong></td><td>Total number of quality issues detected by the connected code-quality platform.</td></tr><tr><td><strong>Bugs</strong></td><td>Number of reliability issues.</td></tr><tr><td><strong>Vulnerabilities</strong></td><td>Number of security issues.</td></tr><tr><td><strong>Code Smells</strong></td><td>Number of maintainability issues.</td></tr><tr><td><strong>Duplicated Lines (%)</strong></td><td>Percentage of code identified as duplicated.</td></tr><tr><td><strong>Test Coverage (%)</strong></td><td>Percentage of analyzed code covered by tests.</td></tr><tr><td><strong>Lines of Code</strong></td><td>Total analyzed codebase size used as an input for normalization and quality analysis.</td></tr></tbody></table>

### Severity and Risk Metrics

<table><thead><tr><th width="291.96014404296875">Metric</th><th>Definition</th></tr></thead><tbody><tr><td><strong>Blocker Issues</strong></td><td>Number of issues classified at the highest configured severity.</td></tr><tr><td><strong>High-Severity Issues</strong></td><td>Number of issues classified as high severity.</td></tr><tr><td><strong>Medium-Severity Issues</strong></td><td>Number of issues classified as medium severity.</td></tr><tr><td><strong>Low-Severity Issues</strong></td><td>Number of issues classified as low severity.</td></tr><tr><td><strong>Security Severity – Blocker, Overall</strong></td><td>Total blocker-level security issues in the analyzed codebase.</td></tr><tr><td><strong>Security Severity – High, Overall</strong></td><td>Total high-severity security issues in the analyzed codebase.</td></tr><tr><td><strong>Security Severity – Blocker, New Period</strong></td><td>New blocker-level security issues introduced during the selected period.</td></tr><tr><td><strong>Security Severity – High, New Period</strong></td><td>New high-severity security issues introduced during the selected period.</td></tr><tr><td><strong>Issue Risk Score</strong></td><td>Risk score calculated using issue severity, quality category, and remediation effort.</td></tr><tr><td><strong>Project Security Risk Score</strong></td><td>Aggregated security risk for the analyzed project.</td></tr><tr><td><strong>Project Reliability Risk Score</strong></td><td>Aggregated reliability risk for the analyzed project.</td></tr><tr><td><strong>Project Maintainability Risk Score</strong></td><td>Aggregated maintainability risk for the analyzed project.</td></tr></tbody></table>

The Issue Risk calculation follows this structure:

```
Issue Risk =
Severity Coefficient
× Quality Category Coefficient
× Remediation Coefficient
```

### Total Code Quality Index Metrics

<table><thead><tr><th width="298.04608154296875">Metric</th><th>Definition</th></tr></thead><tbody><tr><td><strong>Total Code Quality Index – TCQI</strong></td><td>Composite quality score based on issue severity, security, reliability, maintainability, remediation effort, and codebase size.</td></tr><tr><td><strong>Security Index</strong></td><td>Normalized score representing the security health of the codebase.</td></tr><tr><td><strong>Reliability Index</strong></td><td>Normalized score representing reliability health.</td></tr><tr><td><strong>Maintainability Index</strong></td><td>Normalized score representing maintainability health.</td></tr><tr><td><strong>Security Score / Rating</strong></td><td>Overall security rating provided by the connected quality platform.</td></tr><tr><td><strong>Reliability Score / Rating</strong></td><td>Overall reliability rating provided by the connected quality platform.</td></tr><tr><td><strong>Maintainability Score / Rating</strong></td><td>Overall maintainability rating provided by the connected quality platform.</td></tr><tr><td><strong>TCQI Trend</strong></td><td>Change in Total Code Quality Index over time.</td></tr><tr><td><strong>Security Index Trend</strong></td><td>Change in the Security Index over time.</td></tr><tr><td><strong>Reliability Index Trend</strong></td><td>Change in the Reliability Index over time.</td></tr><tr><td><strong>Maintainability Index Trend</strong></td><td>Change in the Maintainability Index over time.</td></tr></tbody></table>

> TCQI coefficients can be configured under the Code Quality administration settings.

***

## Application Performance Metrics

Application Performance metrics are available when Oobeya is connected to a supported APM or monitoring platform.

<table><thead><tr><th width="254.8720703125">Metric</th><th>Definition</th></tr></thead><tbody><tr><td><strong>APDEX Score</strong></td><td>Application Performance Index representing user satisfaction based on response-time thresholds.</td></tr><tr><td><strong>Error Rate (%)</strong></td><td>Percentage of application requests that result in an error.</td></tr><tr><td><strong>Average Response Time</strong></td><td>Average time required for the application or service to respond to requests.</td></tr><tr><td><strong>Transaction Volume</strong></td><td>Number of monitored application transactions during the selected period.</td></tr><tr><td><strong>Incident Count</strong></td><td>Number of detected operational incidents associated with the selected service or application.</td></tr><tr><td><strong>Application Performance Trend</strong></td><td>Change in application performance over time.</td></tr><tr><td><strong>Error Rate Trend</strong></td><td>Change in application errors over time.</td></tr><tr><td><strong>Response Time Trend</strong></td><td>Change in average response time over time.</td></tr></tbody></table>

Availability depends on the connected APM tool and the data exposed by that integration.

***

## Test Analytics

Test Analytics combines manual and automated test data from supported test management and automation systems.

See [Measuring and Improving Test Efficiency](https://docs.oobeya.io/use-cases/measuring-test-efficiency).

<table><thead><tr><th width="281.11083984375">Metric</th><th>Definition</th></tr></thead><tbody><tr><td><strong>Test Efficiency (%)</strong></td><td>Percentage of successful tests across all analyzed test runs.</td></tr><tr><td><strong>Escaped Defects (%)</strong></td><td>Ratio of defects discovered after UAT or the configured testing stage.</td></tr><tr><td><strong>Automation Coverage (%)</strong></td><td>Share of the tested scope or code covered by automated tests.</td></tr><tr><td><strong>UAT Success Rate (%)</strong></td><td>Percentage of successful User Acceptance Testing executions.</td></tr><tr><td><strong>Defect Resolution Rate (%)</strong></td><td>Percentage of detected defects resolved during the test cycle.</td></tr><tr><td><strong>Execution Time (ms)</strong></td><td>Average time required to execute a test.</td></tr><tr><td><strong>Total Test Executions</strong></td><td>Number of test executions during the selected period.</td></tr><tr><td><strong>Successful Test Executions</strong></td><td>Number of test executions completed successfully.</td></tr><tr><td><strong>Failed Test Executions</strong></td><td>Number of failed test executions.</td></tr><tr><td><strong>Manual Test Executions</strong></td><td>Number of manually executed tests.</td></tr><tr><td><strong>Automated Test Executions</strong></td><td>Number of tests executed through automation.</td></tr><tr><td><strong>Test Success Trend</strong></td><td>Change in successful test execution rate over time.</td></tr><tr><td><strong>Escaped Defect Trend</strong></td><td>Change in post-testing defect leakage over time.</td></tr><tr><td><strong>Automation Trend</strong></td><td>Change in automation coverage or automated execution share over time.</td></tr></tbody></table>

***

## AI Coding Assistant Impact

The AI Coding Assistant Impact module measures adoption, engagement, usage effectiveness, and the relationship between AI usage and software engineering outcomes.

See [GitHub Copilot – AI Impact](https://docs.oobeya.io/ai-impact/github-copilot-ai-impact) and [Measuring the Impact of AI Coding Assistants](https://docs.oobeya.io/use-cases/measuring-the-impact-of-ai-coding-assistants).

### User and License Metrics

<table><thead><tr><th width="276.793212890625">Metric</th><th>Definition</th></tr></thead><tbody><tr><td><strong>Licensed Users</strong></td><td>Number of users assigned an AI coding assistant license.</td></tr><tr><td><strong>Active Users</strong></td><td>Number of licensed users who were active during the selected period.</td></tr><tr><td><strong>Engaged Users</strong></td><td>Number of active users who meaningfully interacted with AI coding assistant features.</td></tr><tr><td><strong>Inactive Users</strong></td><td>Licensed users without qualifying activity during the selected period.</td></tr><tr><td><strong>Inactive Users – Last 7 Days</strong></td><td>Users without qualifying AI activity during the last seven days.</td></tr><tr><td><strong>Inactive Users – Last 30 Days</strong></td><td>Users without qualifying AI activity during the last 30 days.</td></tr><tr><td><strong>Adoption Rate (%)</strong></td><td>Percentage of active users who are engaged: <code>Engaged Users / Active Users × 100</code>.</td></tr><tr><td><strong>License Utilization (%)</strong></td><td>Percentage of licensed users who actively use the AI coding assistant.</td></tr><tr><td><strong>User Activation Rate (%)</strong></td><td>Percentage of licensed users who became active during the selected period.</td></tr><tr><td><strong>Total Users</strong></td><td>Total number of users included in AI Impact reporting.</td></tr></tbody></table>

### Suggestion and Acceptance Metrics

<table><thead><tr><th width="285.92742919921875">Metric</th><th>Definition</th></tr></thead><tbody><tr><td><strong>Total Suggestions</strong></td><td>Number of code suggestions generated by the AI coding assistant.</td></tr><tr><td><strong>Accepted Suggestions</strong></td><td>Number of AI-generated suggestions accepted by users.</td></tr><tr><td><strong>Rejected Suggestions</strong></td><td>Number of suggestions not accepted by users.</td></tr><tr><td><strong>Suggestion Acceptance Rate (%)</strong></td><td>Percentage of suggestions accepted: <code>Accepted Suggestions / Total Suggestions × 100</code>.</td></tr><tr><td><strong>Suggested Lines</strong></td><td>Number of code lines suggested by the AI coding assistant.</td></tr><tr><td><strong>Accepted Lines</strong></td><td>Number of suggested code lines accepted by users.</td></tr><tr><td><strong>Line Acceptance Rate (%)</strong></td><td>Percentage of suggested lines accepted: <code>Accepted Lines / Suggested Lines × 100</code>.</td></tr><tr><td><strong>Accepted vs. Rejected Suggestions</strong></td><td>Distribution of accepted and rejected AI suggestions.</td></tr><tr><td><strong>Engagement and Acceptance Trend</strong></td><td>Change in assistant engagement and acceptance over time.</td></tr></tbody></table>

### Feature and Tool Usage Metrics

<table><thead><tr><th width="285.01873779296875">Metric</th><th>Definition</th></tr></thead><tbody><tr><td><strong>IDE Code Completion Usage</strong></td><td>Usage generated through inline IDE code completions.</td></tr><tr><td><strong>Chat Usage</strong></td><td>Usage generated through AI chat interactions.</td></tr><tr><td><strong>Pull Request Integration Usage</strong></td><td>Usage generated through AI features integrated with pull request workflows.</td></tr><tr><td><strong>Feature Usage Distribution</strong></td><td>Distribution of AI usage across completion, chat, PR, and supported feature types.</td></tr><tr><td><strong>Usage by IDE / Editor</strong></td><td>Distribution of AI coding assistant activity by IDE or editor.</td></tr><tr><td><strong>Usage by Programming Language</strong></td><td>Distribution of AI activity by programming language.</td></tr><tr><td><strong>Usage by Model</strong></td><td>Distribution of usage across available AI models.</td></tr><tr><td><strong>Usage by Product</strong></td><td>Distribution across AI coding assistant products or SKUs.</td></tr><tr><td><strong>Usage Trend</strong></td><td>Change in AI coding assistant activity over time.</td></tr></tbody></table>

### Team and User-Level Indicators

<table><thead><tr><th width="305.95703125">Metric</th><th>Definition</th></tr></thead><tbody><tr><td><strong>Team Adoption Rate (%)</strong></td><td>Adoption Rate calculated for a mapped Oobeya team.</td></tr><tr><td><strong>Team Engagement Rate (%)</strong></td><td>Percentage of team members meaningfully interacting with AI features.</td></tr><tr><td><strong>Team Acceptance Rate (%)</strong></td><td>Suggestion or line acceptance rate for a team.</td></tr><tr><td><strong>Most Active Team</strong></td><td>Team with the highest qualifying AI usage during the selected period.</td></tr><tr><td><strong>Most Efficient Usage Team</strong></td><td>Team with the strongest usage-effectiveness result based on configured acceptance and engagement indicators.</td></tr><tr><td><strong>Teams with Low Activity</strong></td><td>Teams whose AI usage remains below the configured activity level.</td></tr><tr><td><strong>Users with Low Activity</strong></td><td>Users whose AI usage remains below the configured activity level.</td></tr><tr><td><strong>Top Active Users</strong></td><td>Users with the highest qualifying AI activity.</td></tr><tr><td><strong>User Adoption and Engagement</strong></td><td>Adoption and engagement indicators shown at user level.</td></tr><tr><td><strong>Actual Contribution vs. AI Contribution</strong></td><td>Comparison between overall development contribution and AI-assisted contribution signals.</td></tr><tr><td><strong>AI Contribution Rate (%)</strong></td><td>Share of tracked development contribution associated with AI-assisted activity, where supported.</td></tr></tbody></table>

***

## AI Cost and Credits

The AI Cost and Credits module provides financial visibility into AI coding assistant consumption at organization, team, user, model, product, repository, and cost-center levels.

See [AI Cost and Credits](https://docs.oobeya.io/ai-impact/ai-cost-and-credits).

### Summary Metrics

<table><thead><tr><th width="260.155029296875">Metric</th><th>Definition</th></tr></thead><tbody><tr><td><strong>Total Users</strong></td><td>Number of users represented in the selected AI cost and credit data.</td></tr><tr><td><strong>AI Credit Pool Value</strong></td><td>Monetary value of the organization’s available AI credit pool.</td></tr><tr><td><strong>Total AI Credits Used</strong></td><td>Total number of AI credits consumed during the selected period.</td></tr><tr><td><strong>Remaining AI Credits</strong></td><td>Unused credits remaining in the configured credit pool.</td></tr><tr><td><strong>Total Gross Cost</strong></td><td>Total cost before discounts or adjustments.</td></tr><tr><td><strong>Discount Amount</strong></td><td>Total discount applied to AI usage charges.</td></tr><tr><td><strong>Net Cost</strong></td><td>Cost after discounts and adjustments.</td></tr><tr><td><strong>Applied Cost per Credit</strong></td><td>Monetary rate applied to each AI credit.</td></tr><tr><td><strong>Remaining Credit Pool Value</strong></td><td>Monetary value of credits remaining in the configured pool.</td></tr><tr><td><strong>Credit Utilization Rate (%)</strong></td><td>Percentage of the total credit pool consumed.</td></tr><tr><td><strong>Cost per User</strong></td><td>Average or individual AI cost attributed to a user.</td></tr><tr><td><strong>Credits per User</strong></td><td>Average or individual AI credits consumed by a user.</td></tr></tbody></table>

Where the standard AI credit rate is configured as USD 0.01:

```
AI Cost (USD) = AI Credits × 0.01
```

The actual rate may differ based on product configuration, provider pricing, contract terms, discounts, and imported billing data.

### Cost and Credit Breakdown Metrics

<table><thead><tr><th width="265.58935546875">Metric</th><th>Definition</th></tr></thead><tbody><tr><td><strong>Cost by User</strong></td><td>AI cost attributed to each user.</td></tr><tr><td><strong>Credits by User</strong></td><td>AI credits consumed by each user.</td></tr><tr><td><strong>Cost by Team</strong></td><td>AI cost aggregated by mapped Oobeya team.</td></tr><tr><td><strong>Credits by Team</strong></td><td>AI credits aggregated by team.</td></tr><tr><td><strong>Cost by Organization</strong></td><td>AI cost aggregated by source organization.</td></tr><tr><td><strong>Credits by Organization</strong></td><td>AI credits aggregated by source organization.</td></tr><tr><td><strong>Cost by Product</strong></td><td>AI cost grouped by AI coding assistant product.</td></tr><tr><td><strong>Credits by Product</strong></td><td>AI credits grouped by product.</td></tr><tr><td><strong>Cost by SKU</strong></td><td>Cost grouped by provider SKU.</td></tr><tr><td><strong>Credits by SKU</strong></td><td>Credit usage grouped by provider SKU.</td></tr><tr><td><strong>Cost by Model</strong></td><td>AI cost grouped by language model.</td></tr><tr><td><strong>Credits by Model</strong></td><td>Credit consumption grouped by language model.</td></tr><tr><td><strong>Model Usage Share (%)</strong></td><td>Percentage of total AI consumption attributed to each model.</td></tr><tr><td><strong>Cost by Repository</strong></td><td>AI cost associated with each repository, where repository data is available.</td></tr><tr><td><strong>Credits by Repository</strong></td><td>AI credit usage associated with each repository.</td></tr><tr><td><strong>Cost by Cost Center</strong></td><td>AI cost aggregated by mapped cost center.</td></tr><tr><td><strong>Credits by Cost Center</strong></td><td>AI credit usage aggregated by cost center.</td></tr></tbody></table>

### Cost Trend Metrics

<table><thead><tr><th width="303.2926025390625">Metric</th><th>Definition</th></tr></thead><tbody><tr><td><strong>Daily Credit Consumption</strong></td><td>AI credits consumed per day.</td></tr><tr><td><strong>Monthly Credit Consumption</strong></td><td>AI credits consumed per month.</td></tr><tr><td><strong>Credit Consumption Trend</strong></td><td>Change in credit usage over time.</td></tr><tr><td><strong>Daily AI Cost</strong></td><td>AI cost generated per day.</td></tr><tr><td><strong>Monthly AI Cost</strong></td><td>AI cost generated per month.</td></tr><tr><td><strong>AI Cost Trend</strong></td><td>Change in AI cost over time.</td></tr><tr><td><strong>Average Daily Cost</strong></td><td>Average AI cost generated per day.</td></tr><tr><td><strong>Average Monthly Cost</strong></td><td>Average AI cost generated per month.</td></tr><tr><td><strong>Projected Period Cost</strong></td><td>Estimated cost for the full reporting period based on current consumption.</td></tr><tr><td><strong>Budget or Pool Consumption Trend</strong></td><td>Progress of cost or credit consumption against the configured pool.</td></tr></tbody></table>

### Estimated Token Metrics

Detailed input, output, and cached-token telemetry may not be provided directly by every AI coding assistant.

When estimated token reporting is enabled, Oobeya may display:

<table><thead><tr><th width="283.34942626953125">Metric</th><th>Definition</th></tr></thead><tbody><tr><td><strong>Estimated Total Token Usage</strong></td><td>Estimated number of tokens represented by the observed AI cost and model-pricing assumptions.</td></tr><tr><td><strong>Estimated Input Tokens</strong></td><td>Estimated input-token volume.</td></tr><tr><td><strong>Estimated Output Tokens</strong></td><td>Estimated output-token volume.</td></tr><tr><td><strong>Estimated Cached Tokens</strong></td><td>Estimated token volume served from provider cache.</td></tr><tr><td><strong>Estimated Token Range</strong></td><td>Low, expected, and high token-usage estimates based on pricing and usage assumptions.</td></tr><tr><td><strong>Estimation Confidence</strong></td><td>Confidence indicator associated with the available model, feature, and pricing information.</td></tr></tbody></table>

> Estimated token metrics are estimates, not provider-reported exact telemetry. They must always be labeled as **Estimated**.

### Cost and Engineering Impact Analysis

The module can compare AI cost and credit consumption with engineering outcome metrics.

<table><thead><tr><th width="306.9544677734375">Analysis</th><th>Description</th></tr></thead><tbody><tr><td><strong>AI Cost vs. Adoption Rate</strong></td><td>Compares financial consumption with AI adoption.</td></tr><tr><td><strong>AI Cost vs. Acceptance Rate</strong></td><td>Compares cost with suggestion or line acceptance.</td></tr><tr><td><strong>AI Cost vs. Coding Efficiency</strong></td><td>Examines whether cost changes coincide with changes in Coding Efficiency.</td></tr><tr><td><strong>AI Cost vs. Coding Impact</strong></td><td>Compares AI spend with the scope and impact of development activity.</td></tr><tr><td><strong>AI Cost vs. Code Churn</strong></td><td>Examines whether increased AI consumption coincides with more or less short-term rework.</td></tr><tr><td><strong>AI Cost vs. Pull Request Cycle Time</strong></td><td>Compares AI spend with pull request review and merge speed.</td></tr><tr><td><strong>AI Cost vs. Lead Time for Changes</strong></td><td>Compares cost with end-to-end delivery time.</td></tr><tr><td><strong>AI Cost vs. Deployment Frequency</strong></td><td>Compares AI spend with production delivery frequency.</td></tr><tr><td><strong>AI Cost vs. Change Failure Rate</strong></td><td>Examines the relationship between AI spend and delivery stability.</td></tr><tr><td><strong>AI Cost vs. Time to Restore Service</strong></td><td>Compares AI spend with production restoration performance.</td></tr><tr><td><strong>AI Cost vs. Technical Debt</strong></td><td>Examines whether AI consumption coincides with changes in technical debt.</td></tr><tr><td><strong>AI Cost vs. Code Quality</strong></td><td>Compares AI spend with quality, security, reliability, and maintainability indicators.</td></tr></tbody></table>

> Correlation does not prove causation. These analyses are intended to identify patterns that should be investigated together with team context, workflow changes, and sample size.

***

## Document Analytics for Confluence

Document Analytics provides visibility into documentation activity, content freshness, contribution patterns, and Confluence Space health.

Metrics may be available at organization, Space, team, and contributor levels.

See [Document Analytics – Confluence](https://docs.oobeya.io/document-analytics/document-analytics-confluence).

### Organization and Space Overview

<table><thead><tr><th width="267.8265380859375">Metric</th><th>Definition</th></tr></thead><tbody><tr><td><strong>Total Spaces</strong></td><td>Total number of Confluence Spaces included in the analysis.</td></tr><tr><td><strong>Active Spaces</strong></td><td>Number of Spaces with qualifying documentation activity during the selected period.</td></tr><tr><td><strong>Inactive Spaces</strong></td><td>Number of Spaces without qualifying activity during the selected period.</td></tr><tr><td><strong>Total Pages</strong></td><td>Total number of analyzed Confluence pages.</td></tr><tr><td><strong>Total Contributors</strong></td><td>Number of contributors associated with analyzed content.</td></tr><tr><td><strong>Active Contributors</strong></td><td>Number of contributors who created or updated content during the selected period.</td></tr><tr><td><strong>Pages per Space</strong></td><td>Average or total number of pages within each Space.</td></tr><tr><td><strong>Contributors per Space</strong></td><td>Number of active contributors associated with each Space.</td></tr><tr><td><strong>Space Activity Score</strong></td><td>Relative indicator representing documentation activity within a Space.</td></tr><tr><td><strong>Space Ranking</strong></td><td>Ranking of Spaces based on selected activity, freshness, or health indicators.</td></tr></tbody></table>

### Documentation Activity Metrics

<table><thead><tr><th width="297.08935546875">Metric</th><th>Definition</th></tr></thead><tbody><tr><td><strong>Pages Created</strong></td><td>Number of pages created during the selected period.</td></tr><tr><td><strong>Pages Updated</strong></td><td>Number of unique pages updated during the selected period.</td></tr><tr><td><strong>Page Update Count</strong></td><td>Total number of page-update activities.</td></tr><tr><td><strong>Content Activity</strong></td><td>Combined view of page creation and update activity.</td></tr><tr><td><strong>Page Creation Trend</strong></td><td>Change in newly created pages over time.</td></tr><tr><td><strong>Page Update Trend</strong></td><td>Change in page-update activity over time.</td></tr><tr><td><strong>Space Activity Trend</strong></td><td>Change in documentation activity for a Space over time.</td></tr><tr><td><strong>Contributor Activity</strong></td><td>Number of page creation and update activities attributed to each contributor.</td></tr><tr><td><strong>Contribution Distribution</strong></td><td>Distribution of documentation activity across contributors.</td></tr><tr><td><strong>Pages Created per Contributor</strong></td><td>Average or individual number of pages created by contributors.</td></tr><tr><td><strong>Pages Updated per Contributor</strong></td><td>Average or individual number of pages updated by contributors.</td></tr></tbody></table>

### Freshness and Documentation Health

<table><thead><tr><th width="283.18157958984375">Metric</th><th>Definition</th></tr></thead><tbody><tr><td><strong>Documentation Health Score</strong></td><td>Composite indicator summarizing freshness, maintenance activity, contributor participation, and other configured documentation signals.</td></tr><tr><td><strong>Fresh Pages</strong></td><td>Number of pages updated within the configured freshness period.</td></tr><tr><td><strong>Fresh Content Rate (%)</strong></td><td>Percentage of analyzed pages classified as fresh.</td></tr><tr><td><strong>Stale Pages</strong></td><td>Number of pages not updated within the configured stale-content threshold.</td></tr><tr><td><strong>Stale Content Rate (%)</strong></td><td>Percentage of analyzed pages classified as stale.</td></tr><tr><td><strong>Average Page Age</strong></td><td>Average age of analyzed pages since creation.</td></tr><tr><td><strong>Average Time Since Last Update</strong></td><td>Average elapsed time since pages were last updated.</td></tr><tr><td><strong>Oldest Page Update Age</strong></td><td>Longest elapsed time since a page was updated.</td></tr><tr><td><strong>Pages Needing Attention</strong></td><td>Number of pages identified as stale, inactive, or requiring review.</td></tr><tr><td><strong>Spaces Needing Attention</strong></td><td>Number of Spaces with low activity, stale content, or other documentation-health risks.</td></tr></tbody></table>

### Team and Ownership Indicators

<table><thead><tr><th width="302.822265625">Metric</th><th>Definition</th></tr></thead><tbody><tr><td><strong>Mapped Teams</strong></td><td>Number of Oobeya teams associated with analyzed Confluence Spaces.</td></tr><tr><td><strong>Spaces with Team Mapping</strong></td><td>Number of Spaces connected to at least one Oobeya team.</td></tr><tr><td><strong>Spaces without Team Mapping</strong></td><td>Number of Spaces without an assigned team relationship.</td></tr><tr><td><strong>Pages by Team</strong></td><td>Documentation pages attributed to each mapped team.</td></tr><tr><td><strong>Activity by Team</strong></td><td>Documentation creation and update activity attributed to each team.</td></tr><tr><td><strong>Contributors by Team</strong></td><td>Active documentation contributors grouped by team.</td></tr><tr><td><strong>Team-to-Space Relationships</strong></td><td>Distribution of mapped team relationships across Spaces.</td></tr><tr><td><strong>Documentation Coverage by Team</strong></td><td>Visibility into whether mapped teams maintain active and current documentation.</td></tr></tbody></table>

> Freshness and health results depend on the configured stale-content period and the availability of Confluence history and contributor data.

***

## Resource Allocation

Resource Allocation shows how planned workload and engineering capacity are distributed across projects and contributors.

See [Resource Allocation](https://docs.oobeya.io/allocations/resource-allocation).

### Overview Metrics

<table><thead><tr><th width="295.1171875">Metric</th><th>Definition</th></tr></thead><tbody><tr><td><strong>Total Projects</strong></td><td>Number of projects included in Resource Allocation analysis.</td></tr><tr><td><strong>Total Resources</strong></td><td>Number of contributors included in the analysis.</td></tr><tr><td><strong>Utilization by Effort (%)</strong></td><td>Resource utilization calculated using estimated effort.</td></tr><tr><td><strong>Utilization by Count (%)</strong></td><td>Resource utilization calculated using work-item count.</td></tr><tr><td><strong>Resource Status Distribution</strong></td><td>Distribution of resources classified as Underutilized, Optimally Utilized, Slightly Overloaded, or Overloaded.</td></tr><tr><td><strong>Planned Work Items</strong></td><td>Number of work items assigned to a resource or team.</td></tr><tr><td><strong>Delivered Work Items</strong></td><td>Number of work items completed by a resource or team.</td></tr><tr><td><strong>Planned Effort</strong></td><td>Estimated effort assigned to a resource or team.</td></tr><tr><td><strong>Delivered Effort</strong></td><td>Estimated effort completed by a resource or team.</td></tr><tr><td><strong>Team Average Capacity</strong></td><td>Delivered work divided by the number of contributors in the team.</td></tr></tbody></table>

### Resource Utilization Metrics

<table><thead><tr><th width="322.19873046875">Metric</th><th>Definition</th></tr></thead><tbody><tr><td><strong>Resource Utilization (%)</strong></td><td>Planned work assigned to a resource relative to the team’s average delivery capacity.</td></tr><tr><td><strong>Team Utilization (%)</strong></td><td>Aggregated utilization level of a team.</td></tr><tr><td><strong>Underutilized Resources</strong></td><td>Resources whose utilization is below the configured lower threshold.</td></tr><tr><td><strong>Optimally Utilized Resources</strong></td><td>Resources operating within the configured optimal range.</td></tr><tr><td><strong>Slightly Overloaded Resources</strong></td><td>Resources above the optimal range but below the highest overload threshold.</td></tr><tr><td><strong>Overloaded Resources</strong></td><td>Resources whose utilization exceeds the configured overload threshold.</td></tr></tbody></table>

Default calculation:

```
Team Average Capacity =
Delivered Work Items / Number of Contributors
```

```
Resource Utilization (%) =
Planned Work Items / Team Average Capacity × 100
```

Default classification:

<table><thead><tr><th width="284.8621826171875">Utilization</th><th>Status</th></tr></thead><tbody><tr><td><strong>≤ 85%</strong></td><td>Underutilized</td></tr><tr><td><strong>85%–110%</strong></td><td>Optimally Utilized</td></tr><tr><td><strong>110%–130%</strong></td><td>Slightly Overloaded</td></tr><tr><td><strong>> 130%</strong></td><td>Overloaded</td></tr></tbody></table>

Thresholds can be customized by administrators.

### Project Allocation Metrics

<table><thead><tr><th width="302.4014892578125">Metric</th><th>Definition</th></tr></thead><tbody><tr><td><strong>Project Allocation (%)</strong></td><td>Percentage of a contributor’s planned work assigned to a particular project.</td></tr><tr><td><strong>Allocation by Work-Item Count (%)</strong></td><td>Project allocation calculated using planned work-item count.</td></tr><tr><td><strong>Allocation by Effort (%)</strong></td><td>Project allocation calculated using estimated effort.</td></tr><tr><td><strong>Projects per Contributor</strong></td><td>Number of projects to which a contributor is allocated.</td></tr><tr><td><strong>Contributors per Project</strong></td><td>Number of contributors allocated to a project.</td></tr><tr><td><strong>Allocation Distribution</strong></td><td>Distribution of contributor capacity across projects.</td></tr></tbody></table>

Calculation:

```
Project Allocation (%) =
Planned Items for the Contributor in the Project
/
Total Planned Items for the Contributor Across All Projects
× 100
```

***

## Bug Report

The Bug Report module provides organization- and team-level visibility into open defects, severity, ownership, and bug trends.

See [Bug Report Dashboard](https://docs.oobeya.io/bug-report/bug-report-dashboard).

<table><thead><tr><th width="262.41448974609375">Metric or Indicator</th><th>Definition</th></tr></thead><tbody><tr><td><strong>Open Bugs</strong></td><td>Number of bug-type work items currently in an open status.</td></tr><tr><td><strong>Open Bugs Over Time</strong></td><td>Trend of open bugs across the selected period.</td></tr><tr><td><strong>Bugs by Severity</strong></td><td>Distribution of bugs across Blocker, Critical, High, Medium, and Low severity levels.</td></tr><tr><td><strong>Blocker Bugs</strong></td><td>Number of open bugs mapped to Blocker severity.</td></tr><tr><td><strong>Critical Bugs</strong></td><td>Number of open bugs mapped to Critical severity.</td></tr><tr><td><strong>High-Severity Bugs</strong></td><td>Number of open bugs mapped to High severity.</td></tr><tr><td><strong>Medium-Severity Bugs</strong></td><td>Number of open bugs mapped to Medium severity.</td></tr><tr><td><strong>Low-Severity Bugs</strong></td><td>Number of open bugs mapped to Low severity.</td></tr><tr><td><strong>Bug Distribution by Team</strong></td><td>Number or percentage of bugs associated with each mapped team.</td></tr><tr><td><strong>Team Bugs</strong></td><td>Bugs assigned to or associated with the selected team.</td></tr><tr><td><strong>Unassigned Bugs</strong></td><td>Bugs without an assigned owner.</td></tr><tr><td><strong>Other Teams’ Bugs</strong></td><td>Bugs visible in the current scope but associated with other teams.</td></tr><tr><td><strong>Bug Status Distribution</strong></td><td>Distribution of bugs across mapped workflow statuses.</td></tr><tr><td><strong>Bug Type Distribution</strong></td><td>Distribution across configured Bug, Defect, Problem, Incident, Error, or similar work-item types.</td></tr><tr><td><strong>Bug Trend by Severity</strong></td><td>Change in open bugs for each severity level over time.</td></tr></tbody></table>

Bug reporting depends on correct category and severity mapping in the administration settings.

***

## Activity Heatmap

Activity Heatmap visualizes daily developer activities and helps identify workload imbalance, concentrated contribution, unusually high activity, and low participation.

See [Activity Heatmap](https://docs.oobeya.io/activity-heatmap/activity-heatmap).

### Activity Inputs

<table><thead><tr><th width="238.089599609375">Metric</th><th>Definition</th></tr></thead><tbody><tr><td><strong>Commits</strong></td><td>Number of commits made by a developer.</td></tr><tr><td><strong>Lines Added</strong></td><td>Number of code lines added.</td></tr><tr><td><strong>Lines Deleted</strong></td><td>Number of code lines deleted.</td></tr><tr><td><strong>Lines Edited</strong></td><td>Number of code lines modified.</td></tr><tr><td><strong>PRs Created</strong></td><td>Number of pull requests created.</td></tr><tr><td><strong>PR Reviews</strong></td><td>Number of code reviews performed.</td></tr><tr><td><strong>PR Approvals</strong></td><td>Number of pull requests approved.</td></tr><tr><td><strong>PR Needs Work</strong></td><td>Number of pull requests returned for changes.</td></tr><tr><td><strong>PR Comments</strong></td><td>Number of comments added to pull requests.</td></tr></tbody></table>

Each activity type can have a configurable coefficient that determines its contribution to the score.

### Calculated Scores

<table><thead><tr><th width="252.76470947265625">Metric or Score</th><th>Definition</th></tr></thead><tbody><tr><td><strong>Commit Activity Score</strong></td><td>Weighted score generated from commits and code-change activity.</td></tr><tr><td><strong>Pull Request Activity Score</strong></td><td>Weighted score generated from PR creation, review, approval, change-request, and comment activity.</td></tr><tr><td><strong>Total Activity Score</strong></td><td>Combined weighted score across commit and pull request activity.</td></tr><tr><td><strong>Daily Rank Ratio</strong></td><td>A developer’s daily score relative to the highest-scoring developer for that day.</td></tr><tr><td><strong>Daily Normalized Score</strong></td><td>Daily activity score normalized for team comparison.</td></tr><tr><td><strong>Activity Z-Score</strong></td><td>Standardized activity score calculated from the team’s daily distribution.</td></tr><tr><td><strong>Heatmap Score</strong></td><td>Normalized 0–100 score used to determine heatmap intensity.</td></tr><tr><td><strong>Developer Total Score</strong></td><td>Total activity score attributed to a developer during the selected period.</td></tr><tr><td><strong>Team Activity Distribution</strong></td><td>Distribution of normalized activity scores across team members.</td></tr></tbody></table>

> Activity Heatmap scores represent activity intensity, not work quality, value, or individual performance.

***

## Gamification

Gamification converts selected Oobeya metrics and manually defined KPIs into configurable points, rounds, leagues, and rankings.

See [Gamification](https://docs.oobeya.io/gamification/gamification).

Gamification can use metrics from:

* Project Management
* Development Analytics
* Pull Request Analytics
* Code Quality
* Security
* Engineering Symptoms
* Manually defined KPIs

### Gamification Outputs

<table><thead><tr><th width="261.750244140625">Metric or Score</th><th>Definition</th></tr></thead><tbody><tr><td><strong>Metric Result</strong></td><td>Actual value of the selected engineering metric for a scoring round.</td></tr><tr><td><strong>Metric Threshold</strong></td><td>Configured value range used to assign points.</td></tr><tr><td><strong>Metric Points</strong></td><td>Points earned from a metric based on its scoring thresholds.</td></tr><tr><td><strong>Manual KPI Points</strong></td><td>Points manually entered and approved by a league referee.</td></tr><tr><td><strong>Round Score</strong></td><td>Total points earned by a team during a scoring round.</td></tr><tr><td><strong>Approved Round Score</strong></td><td>Round Score after referee review and approval.</td></tr><tr><td><strong>Cumulative Score</strong></td><td>Total points accumulated across completed rounds.</td></tr><tr><td><strong>Team Rank</strong></td><td>Position of a team based on cumulative or selected-round score.</td></tr><tr><td><strong>League Ranking</strong></td><td>Ranking of all participating teams within a league.</td></tr><tr><td><strong>Maximum Available Points</strong></td><td>Maximum points a team can earn under the configured rules.</td></tr><tr><td><strong>Achievement Rate (%)</strong></td><td>Earned points relative to the maximum available points, where displayed.</td></tr></tbody></table>

> Gamification scores are derived outputs. The underlying engineering metrics retain their original definitions and units.

***

## Team Scorecards, Developer Profiles, and Dashboards

Team Scorecards, Developer Profiles, and Custom Dashboards do not create a separate set of underlying engineering metrics.

They present and aggregate metrics from the modules listed above at different organizational levels.

### Team Scorecards

Team Scorecards can include:

* Development Analytics
* Pull Request Analytics
* DORA Metrics
* Project Analytics
* Code Quality
* Test Analytics
* Bug Analytics
* AI Impact
* Resource Allocation
* Custom scorecard widgets

Metrics are filtered by the repositories, projects, integrations, and users mapped to the selected team.

### Developer Profiles

Developer Profiles can include:

* Coding Impact
* Coding Efficiency
* Work Type
* Code Churn
* Commit activity
* Repository contribution
* Pull requests
* Code reviews
* Code quality contribution
* Project activity
* AI usage and engagement, where available

Developer-level metrics depend on accurate identity matching across connected tools.

***

## Engineering Insights and Symptoms

Engineering Insights and Symptoms analyze multiple metrics together to identify significant patterns, risks, improvements, and recurring engineering anti-patterns.

They are analytical outputs rather than separate raw metrics.

Examples include:

* Recurring high rework
* Oversized pull requests
* Review bottlenecks
* High cognitive load
* Low Coding Efficiency
* Delivery slowdown
* Low Sprint Predictability
* High Change Failure Rate
* Unbalanced contribution
* Rising technical debt
* Workload imbalance

Each insight or Symptom may include:

<table><thead><tr><th width="283.422607421875">Indicator</th><th>Definition</th></tr></thead><tbody><tr><td><strong>Current Value</strong></td><td>Metric value for the selected reporting period.</td></tr><tr><td><strong>Previous Period Value</strong></td><td>Metric value for the comparison period.</td></tr><tr><td><strong>Change (%)</strong></td><td>Percentage change between periods.</td></tr><tr><td><strong>Benchmark Value</strong></td><td>Relevant engineering benchmark or configured target.</td></tr><tr><td><strong>Primary Contributor</strong></td><td>Repository, team member, project, service, or pipeline most associated with the result.</td></tr></tbody></table>

See the [Symptoms Catalog](https://docs.oobeya.io/team-insights-and-symptoms/symptoms-catalog) and [Engineering Benchmarks](https://docs.oobeya.io/team-insights-and-symptoms/engineering-benchmarks).

***

## Important Interpretation Guidelines

### Use Trends, Not Isolated Values

A single value rarely provides enough context. Review:

* Current value
* Previous-period value
* Long-term trend
* Team history
* Engineering benchmark
* Product and workflow context

### Do Not Rank Developers Using Activity Volume Alone

Metrics such as commits, code lines, pull requests, or Activity Heatmap scores should not be used alone to evaluate individual performance.

They do not directly measure:

* Business value
* Code quality
* Task difficulty
* Mentoring
* Architecture work
* Incident response
* Collaboration outside tracked tools
* Product discovery
* Customer impact

### Correlation Does Not Prove Causation

When two metrics move together, use language such as:

* Appears to be associated with
* Coincides with
* May be contributing to
* Is concentrated in
* Should be investigated together with

Avoid assuming that one metric directly caused another without supporting evidence.

### Validate Data Configuration

Unexpected metric results are often related to:

* Incorrect user or contributor mapping
* Missing repositories
* Incorrect branch selection
* Incorrect production pipeline mapping
* Missing incident sources
* Incorrect workflow status mapping
* Excluded work-item types
* Missing effort values
* Incorrect team membership
* Missing Confluence Space mappings
* Missing AI product, model, or cost-center mappings

***

## Related Documentation

* [Oobeya Quick Onboarding Guide](https://docs.oobeya.io/getting-started/oobeya-quick-onboarding-guide)
* [Git Analytics – Metric Definitions](https://docs.oobeya.io/gitwiser-repo-analytics/git-analytics-metric-definitions)
* [DORA Metrics Introduction](https://docs.oobeya.io/deployment-analytics/dora-metrics-introduction)
* [Project Analytics – Metric Definitions](https://docs.oobeya.io/project-analytics/project-analytics-metric-definitions)
* [Total Code Quality Index](https://docs.oobeya.io/quality-analytics/total-code-quality-index-tcqi)
* [Test Analytics](https://docs.oobeya.io/use-cases/measuring-test-efficiency)
* [GitHub Copilot – AI Impact](https://docs.oobeya.io/ai-impact/github-copilot-ai-impact)
* [AI Cost and Credits](https://docs.oobeya.io/ai-impact/ai-cost-and-credits)
* [Document Analytics – Confluence](https://docs.oobeya.io/document-analytics/document-analytics-confluence)
* [Resource Allocation](https://docs.oobeya.io/allocations/resource-allocation)
* [Bug Report Dashboard](https://docs.oobeya.io/bug-report/bug-report-dashboard)
* [Activity Heatmap](https://docs.oobeya.io/activity-heatmap/activity-heatmap)
* [Gamification](https://docs.oobeya.io/gamification/gamification)
* [Symptoms Catalog](https://docs.oobeya.io/team-insights-and-symptoms/symptoms-catalog)
* [Engineering Benchmarks](https://docs.oobeya.io/team-insights-and-symptoms/engineering-benchmarks)


# Product Tour

Let's take a quick tour into Oobeya’s features.

Check out how Oobeya empowers engineering leaders to gain more visibility, clear insights, and make data-driven decisions.

### Let's take a product tour:

{% embed url="<https://app.storylane.io/share/l6bz80qutw12>" %}
Oobeya Product Tour
{% endembed %}


# Get Started with Oobeya

### Welcome to the Oobeya Discovery Questionnaire! <a href="#header_welcomepage" id="header_welcomepage"></a>

To help us understand exactly what you need, please take 2-3 minutes to answer the following questions.

{% embed url="<https://form.jotform.com/241291821143045>" %}


# Playground: Live Demo

See Oobeya in Action!

## **READY FOR YOU** :rocket:&#x20;

We've launched our playground to show you **Oobeya in action** 🚀&#x20;

You can see a ***live demo*** of *Team Insights, Team Scorecards, Git Repository Analytic*s, *Pull Request Analytics, DORA Metrics, Agile Board Analytics, Dashboards,* and other significant features...

Click and see the [***Oobeya** Playground*](https://playground.oobeya.io/playground-register)*.*&#x20;

## **WHAT'S NEXT? 🎯**&#x20;

After surfing on Oobeya Playground, you may want to **see your data in Oobeya**. Consider using Oobeya limited docker edition to host your instance quickly or [contact us](https://oobeya.io/contact/) to get a full [package ](https://oobeya.io/pricing)of Oobeya.


# Oobeya Installation Tutorial & Requirements (Docker)

Install Oobeya On-Premise Edition on a dedicated Linux server or virtual machine using Docker Compose.

This deployment model is a good fit for organizations that want to run Oobeya inside infrastructure they control without operating a Kubernetes cluster.

For Kubernetes-based environments, use the [Helm](https://docs.oobeya.io/installations/oobeya-installation-tutorial-helm), [Kubernetes](https://docs.oobeya.io/installations/oobeya-installation-tutorial-kubernetes), or [OpenShift](https://docs.oobeya.io/installations/oobeya-installation-tutorial-openshift) installation guides instead.

***

### **PREREQUISITES**

If you want to run Oobeya on a server (VM, AWS, Azure, GCP, etc.) without any performance issues, you should set the minimum resources as follows:

#### **Minimum Hardware Requirements:**

* 16GB RAM *(The server requires at least 16GB of RAM to run efficiently for enterprises.)*
* 8 CPU / 4 Cores
* 100GB Disk Space

{% hint style="info" %}
For advanced infrastructure sizing guidance, see [Oobeya On-Premise Infrastructure Requirements](https://oobeya.io/on-premise/requirements).

For large enterprise deployments, validate sizing with the Oobeya team before production rollout.
{% endhint %}

#### **Container Runtime**

The Docker installation requires:

* Docker Engine
* Docker Compose

#### Supported External NoSQL Databases

* MongoDB Atlas, Azure CosmosDB, AWS DocumentDB, GCP Firestore, Custom MongoDB Server.

#### **Container Registry Access**

Allow outbound HTTPS access to the required Oobeya container registry:

```
oobeya.azurecr.io
```

If direct outbound registry access is not allowed, organizations can use an approved internal registry mirror or an offline image-transfer process.

{% hint style="info" %}
Coordinate offline or restricted-network installations with the Oobeya team before deployment.
{% endhint %}

#### **Request Oobeya Registry Credentials**

Oobeya application images are distributed through the Oobeya container registry. You will need registry credentials provided by the Oobeya team before starting the installation.

<a href="https://oobeya.io/contact" class="button primary" data-icon="paper-plane-top">Request Your Docker Credentials</a>

***

### **On-Premise Installation Video**

{% embed url="<https://files.gitbook.com/v0/b/gitbook-x-prod.appspot.com/o/spaces%2F-MGIlBSTjQtZxUoFwUx4%2Fuploads%2FKIaYiYhgkesMJ5gtF3LE%2FEDIT-oobeya-installation-video.mp4?alt=media&token=bb3e770e-b742-442f-a354-798d66afede8>" %}

### **Installing Oobeya Using Docker Compose**

Follow the steps below for the **quick** and **easy installation** of Oobeya to **work with your data**.

1- **Create** a new working directory.

```
mkdir oobeya
cd oobeya
```

2- **Download** the Oobeya installation package.

```
wget https://oobeya-app.s3.amazonaws.com/oobeya-configs.zip
```

3- **Unzip** the installation package.

```
unzip oobeya-configs.zip
```

4- **Edit&#x20;*****`env.list`*** file and enter your domain name or IP address (browse URL) for the following parameters:

{% code title="env.list" %}

```bash
CORS_ALLOWED_ORIGIN=https://oobeya.mycompany.com,http://<server-IP>
OOBEYA_GATEWAY_BASE_URL=https://oobeya.mycompany.com,http://<server-IP>
```

{% endcode %}

5- The mount volume directory uses the `/data-oobeya` directory by default. You can use the `.env` file to change it.

When the application is run, it automatically creates this directory; it is recommended to use a **user with the necessary permissions** to create the directory.

6- You need to log in to pull Oobeya images. **The Oobeya Team will provide Docker login credentials**. [Request your credentials](https://oobeya.io/contact).

```
docker login -u {{user_name}} -p {{password}} oobeya.azurecr.io
```

7- **Run** the application using *`docker-compose`*.

```
docker-compose up -d
```

8- **Navigate** to the Oobeya browse URL to launch the Oobeya registration page. Then, set a new password for the *root user* of Oobeya.

9\. Log in with the ***root*** user and explore Oobeya!

{% hint style="success" %}
Now you are ready to connect your data sources with Oobeya to get **complete visibility** of your **software's health**.
{% endhint %}


# Oobeya Version Upgrade For the docker-compose Installations

## **Access Requirements**

* Access to [Azure Container Registry (ACR)](https://oobeya.azurecr.io)
* Docker login credentials for ACR access (provided by the Oobeya Team if you don't have one).

***

## **Upgrading Oobeya version**&#x20;

Follow the steps below for the **quick** and **easy version upgrade** of Oobeya.

1- Navigate to the directory where the docker-compose file is located.

2- Pull the latest Oobeya docker images by running the below command.

```
docker-compose pull
```

3- Restart the application using the docker-compose command below.

```
docker-compose down && docker-compose up -d
```


# HTTPS Configuration For Docker Installations

1- Copy the SSL Key and SSL Crt pair to the "nginx" folder under the OOBEYA-DIRECTORY directory by changing their names to ssl.key and ssl.crt.

```bash
$ mv example.key /OOBEYA-DIRECTORY/nginx/ssl.key
$ mv example.crt /OOBEYA-DIRECTORY/nginx/ssl.crt
```

2- In the 'server\_name' section, write your domain for both port 80 and port 443.

* /OOBEYA-DIRECTORY/nginx/nginx.conf

```json
  server {
    listen       80;
    listen       [::]:80;
    server_name  ops.oobeya.io;                         # YOUR DOMAIN
    access_log /var/log/nginx/access.log compression;
```

```json
  server { # This new server will watch for traffic on 443
        listen              443 ssl;
        server_name         ops.oobeya.io;              # YOUR DOMAIN
        ssl_certificate     /etc/nginx/ssl.crt;
        ssl_certificate_key /etc/nginx/ssl.key;
```

3- Remove the comment lines under the Nginx service in docker-compose.yml.

* /OOBEYA-DIRECTORY/docker-compose.yml

```yaml
  oobeya-nginx:
    image: "oobeya.azurecr.io/oobeya-nginx-gateway:latest"
    restart: "always"
    ports:
      - "80:80"
#      - "443:443"
    container_name: "oobeya-nginx"
#    volumes:
#      - ./nginx/nginx.conf:/etc/nginx/nginx.conf
#      - ./nginx/ssl.crt:/etc/nginx/ssl.crt
#      - ./nginx/ssl.key:/etc/nginx/ssl.key
```

4- Add "<https://your-domain>" to the CORS\_ALLOWED\_ORIGIN variable to be accessed with HTTPS.

```bash
$ vi /OOBEYA-DIRECTORY/env.list

CORS_ALLOWED_ORIGIN=https://your-domain
```

5- Finally, you can restart the Oobeya app using docker-compose.

```bash
$ docker-compose down && docker-compose up -d
```


# Oobeya Installation Tutorial (Helm)

This guide explains how to install Oobeya on your Kubernetes cluster with Helm.

To install using the Helm Artifact Repository, you can follow the steps on [ArtifactoryHub](https://artifacthub.io/packages/helm/oobeya/oobeya).

### Contents

* [Minimum Hardware Requirements](#minimum-hardware-requirements)
* [Install Oobeya Helm Chart](#install-oobeya-helm-chart)
* [Configure Persistent Volumes](#configure-persistent-volumes)
* [Configure custom MongoDB without PVC](#configure-custom-mongodb-without-pvc)
* [Configuration](#configuration)
* [Installing Oobeya with Helm](#installing-oobeya-with-helm)

**Warning**: If you are not using Custom MongoDB, a StorageClass and a PVC are required.

#### **Minimum Hardware Requirements:**

* 16GB RAM *(Server requires at least 16GB of RAM to run efficiently for enterprises.)*
* 8 CPU / 4 Core
* 100GB Disk Space

#### Supported External NoSQL Databases

* MongoDB Atlas, Azure CosmosDB, AWS DocumentDB, GCP Firestore, Custom MongoDB Server.

### Install Oobeya Helm Chart

Please create a namespace for Oobeya.

```
kubectl create namespace oobeya
```

Please request a token from the Oobeya team for registry access.

```
kubectl create secret docker-registry oobeya-secret \
     --docker-server=https://oobeya.azurecr.io \
     --docker-username=(Credentials-Name) \
     --docker-password=(Your-Credentials) \
     --namespace=oobeya
```

To install using the Helm Artifact Repository, you can follow the steps on [ArtifactoryHub](https://artifacthub.io/packages/helm/oobeya/oobeya).

You can download the chart package.

```
wget https://oobeya-app.s3.us-east-1.amazonaws.com/oobeya-helm-lts.tar

tar -xvf oobeya-helm-lts.tar && cd oobeya
```

You can push the Oobeya directory to the ArgoCD or Kustomize Git Repository.

### Configure Persistent Volumes

Persistent Volume Claim (PVCs) are defined in the following files:

```
vi (pwd)/values.yaml
```

```
storage:
    mongoStorage:
      pvcName: oobeya-mongo-pvc
      storageClassName: local-path                      # StorageClass Name
      size: 100Gi                                       # Storage Size

    gitwiserStorage:
      enabled: true
      pvcName: oobeya-gitwiser-pvc
      storageClassName: local-path                      # StorageClass Name
      size: 20Gi                                        # Storage Size
```

Edit file to set the correct StorageClass name for your environment.

### Configure custom MongoDB without PVC

If you enable External MongoDB, you will no longer need a Storage Class or a PVC.

Steps required to create a user and database for Oobeya:

```
> use admin
```

```
db.createUser({
  user: "mongodb",                        # Your USERNAME
  pwd: "mongodb",                         # Your PASSWORD
  roles: [
    { role: 'readWrite', db: 'addonsDB' },
    { role: 'readWrite', db: 'admin' },
    { role: 'readWrite', db: 'gatewayDB' },
    { role: 'readWrite', db: 'agilespaceDB' },
    { role: 'readWrite', db: 'config' },
    { role: 'readWrite', db: 'dashboardDB' },
    { role: 'readWrite', db: 'devteamDB' },
    { role: 'readWrite', db: 'gitwiserDB' },
    { role: 'readWrite', db: 'uaaDB' }
  ]
});
```

If you're connecting to your external MongoDB, you'll need to fill in the blanks here:

```
oobeyaExternalMongo:
  isExternal: false                                       # Set true
  host: "oobeya-mongo.oobeya.svc.cluster.local"           # Set your MongoDB domain or IP
  port: "27017"                                           # Set MongoDB Port
  user: ""
  pass: ""
  authSource: "admin"
  databases:
    dashboard: "dashboardDB"
    devteam: "devteamDB"
    gitwiser: "gitwiserDB"
    uaa: "uaaDB"
    agilespace: "agilespaceDB"
    addons: "addonsDB"
    gateway: "gatewayDB"
```

### Configuration

To access Oobeya from the browser, you need to add the domain name or machine IP to the configuration.

```
vi (pwd)/values.yaml
```

* Please edit this:

1. values.yaml.oobeyaDashboard

```
 - corsAllowedOrigin: "http://your-IP-or-Domain"
```

2. values.yaml.oobeyaGateway

```
 - corsAllowedOrigin: "http://your-IP-or-Domain"
 - gatewayBaseOrigin: "http://your-IP-or-Domain"
```

If you're using `Nginx Ingress` for access:

```
ingressNginx:
  enabled: false
  className: "nginx"
  host: "oobeya.local"
```

If you're using `Traefik Ingress`, similar definitions are included in the values.yaml file.

### Installing Oobeya with Helm

```
helm lint .
```

```
helm upgrade --install oobeya . \
  --namespace oobeya
```

If you want to deploy a specific version:

```
helm upgrade --install oobeya . \
  --namespace oobeya \
  --set beVersion=2.0.xxx \
  --set feVersion=2.0.xxx
```


# Oobeya Version Upgrade for Helm Installations

### Access Requirements

Access to Azure Container Registry (ACR)

Docker login credentials for ACR access (provided by the Oobeya Team if you don't have one)

### Upgrading Oobeya version

Follow the steps below for the quick and easy version upgrade of Oobeya.

1- List the pods under the oobeya namespace.

```
kubectl get pods -n oobeya
```

It is given as `imagePullPolicy: Always` in the deployment.yml manifest files.

`oobeya-mongo` and `oobeya-rabbitmq` are static pods. They do not need to receive updates.

### Set new versions

If you are proceeding with the static version:

```
helm upgrade --install oobeya . \
  --namespace oobeya \
  --set beVersion=2.0.xxx \
  --set feVersion=2.0.xxx
```

***

If you are proceeding with the latest strategy:

$ vi values.yaml

```
uiVersion: latest
beVersion: latest
```

Without changing anything:

Deployments should be restarted as a rollout restart.

**Deployments List:**

* `oobeya-dashboard`
* `oobeya-uaa`

After those services are up and running:

* `oobeya-agilespace`
* `oobeya-addons`
* `oobeya-devteam`
* `oobeya-gateway`
* `oobeya-gitwiser`
* `oobeya-ui`

2- Run the update command with the deployment name

```
kubectl rollout restart deployment <deployment-name> -n oobeya
```

3- Check the condition of the pods again

```
kubectl get pods -n oobeya
```


# Custom SSL Configuration

Add Custom SSL with Helm files

### Add new secret object

```
$ vi example-ssl-secret.yml
```

If necessary, you can add multiple SSL files as follows.

```
apiVersion: v1
kind: Secret
metadata:
  name: oobeya-addons-ssl
  namespace: oobeya
type: Opaque
stringData:
  ssl.crt: |
    -----BEGIN CERTIFICATE-----
    -----END CERTIFICATE-----


  tls.key: |
    -----BEGIN CERTIFICATE-----
    -----END CERTIFICATE-----

    
  another-custom-ssl.crt: |
    -----BEGIN CERTIFICATE-----
    -----END CERTIFICATE-----
```

### Edit values.yaml

```
$ vi values.yaml
```

### Find customSSL step

```
customSSL:
    secretSSL:
      enabled: false                # Set false -> true
      name: ""                      # The secret name where SSL files are generated
      mountPath: "/srv/certs"
      certFileNames:
          - ""                      # Write SSL file name, example: "ssl-gitlab.crt"
          - ""                      # If there is one, the name of the other SSL file added
          - ""                      # If there is one, the name of the other SSL file added
```

To confirm that SSLs are actually deployed to the Pod:

```
$ kubectl logs oobeya-addons-xxx-xxx -n oobeya
```

Expected output example:

```
SSL Conf enabled: true
SSL Cert Alias:
SSL Cert Files: ssl.crt tls.key another-custom-ssl.crt
****************************************************************
Copying certificate file with command: cp /srv/certs/ssl.crt /opt/java/openjdk/lib/security/ssl.crt
Certificate was added to keystore

Copying certificate file with command: cp /srv/certs/tls.key /opt/java/openjdk/lib/security/tls.key
Certificate was added to keystore

Copying certificate file with command: cp /srv/certs/another-custom-ssl.crt /opt/java/openjdk/lib/security/another-custom-ssl.crt
Certificate was added to keystore
```


# Oobeya Installation Tutorial (Kubernetes)

Install Oobeya On-Premise Edition Using Kubernetes.

This guide explains how to install **Oobeya** on your Kubernetes cluster.

#### **Minimum Hardware Requirements:**

* 16GB RAM *(Server requires at least 16GB of RAM to run efficiently for enterprises.)*
* 8 CPU / 4 Core
* 100GB Disk Space

#### Supported External NoSQL Databases

* MongoDB Atlas, Azure CosmosDB, AWS DocumentDB, GCP Firestore, Custom MongoDB Server.

{% hint style="warning" %}
**Warning**: Installation requires a valid StorageClass.&#x20;

Before you begin, please ensure that your cluster has a configured **StorageClass**, as persistent volumes are required.
{% endhint %}

{% hint style="info" %}
**Note**: Oobeya uses an Ingress object to expose the application interface. The default configuration is provided in `ingresses.yml`. If you are using **Traefik**, you can use `traefik-route.yml` instead.
{% endhint %}

***

Follow the steps below for the **quick** and **easy installation** of Oobeya to **work with your data**.

### 1. Create a Namespace

Create a dedicated namespace for Oobeya:

```bash
kubectl create namespace oobeya
```

***

### 2. Request Access Credentials

You will need a registry access token from the Oobeya team. Once received, create a Kubernetes secret:

```bash
kubectl create secret docker-registry oobeya-secret \
  --docker-server=https://oobeya.azurecr.io \
  --docker-username=<CREDENTIALS-NAME> \
  --docker-password=<YOUR-CREDENTIALS> \
  --namespace=oobeya
```

***

### 3. Download Manifest Files

Download and extract the Oobeya installation manifests:

```bash
wget https://oobeya-app.s3.us-east-1.amazonaws.com/oobeya-cluster-install.tar
tar -xvf oobeya-cluster-install.tar && cd oobeya
```

***

### 4. Configure Persistent Volumes

Persistent Volume Claims (PVCs) are defined in the following files:

* `oobeya-mongo.yml` and `oobeya-rabbitmq.yml`     &#x20;

Edit each file to set the correct **StorageClass** name for your environment.

***

### 5. Configure Domain or IP

To access Oobeya in a browser, configure your **domain name** or **machine IP**.

Edit the `configmaps.yml` file:

```bash
vi $(pwd)/configmaps.yml
```

Update the following fields:

**1. dashboard-configmap**

```yaml
CORS_ALLOWED_ORIGIN: "http://your-IP-or-Domain"
```

**2. gateway-configmap**

```yaml
CORS_ALLOWED_ORIGIN: "http://your-IP-or-Domain"
OOBEYA_GATEWAY_BASE_URL: "http://your-IP-or-Domain"
```

***

### 6. Deploy Oobeya

Apply all manifests to your Kubernetes cluster:

```bash
kubectl apply -f .
```

***

### 7. Access Oobeya

* By default, Oobeya runs on **port 80**.
* Once all services show `1/1 Running`, you can access the Oobeya interface from your browser at:

```
http://your-IP-or-Domain
```

***

### **Next Steps**

After installation, you can proceed with:

* Creating the first user
* [Entering the License Key](/administration/license-management)
* [Connecting Integrations](/integrations/all-integrations)


# Oobeya Version Upgrade for Kubernetes Installations

### Access Requirements

* Access to Azure Container Registry (ACR)
* Docker login credentials for ACR access (provided by the Oobeya Team if you don't have one)

### Upgrading Oobeya version

Follow the steps below for the quick and easy version upgrade of Oobeya.

1- List the pods under the oobeya namespace.

```
kubectl get pods -n oobeya
```

It is given as `imagePullPolicy: Always` in the deployment.yml manifest files.

`oobeya-mongo` and `oobeya-rabbitmq` are static pods. They do not need to receive updates.

Deployments should be restarted as a rollout restart.

**Note**: The `oobeya-dashboard` deployment must be restarted first, after which the other deployments can be restarted.

**Deployments List:**

* `oobeya-dashboard`
* `oobeya-uaa`

After those services are up and running:

* `oobeya-agilespace`
* `oobeya-addons`
* `oobeya-devteam`
* `oobeya-gateway`
* `oobeya-gitwiser`
* `oobeya-ui`

2- Run the update command with the deployment name

```
kubectl rollout restart deployment <deployment-name> -n oobeya
```

3- Check the condition of the pods again

```
kubectl get pods -n oobeya
```


# Oobeya Installation Tutorial (OpenShift)

Install Oobeya On-Premise Edition Using Openshift.

**Minimum Hardware Requirements:**

* 16GB RAM *(Server requires at least 16GB of RAM to run efficiently for enterprises.)*
* 8 CPU / 4 Core
* 100GB Disk Space

#### Supported External NoSQL Databases

* MongoDB Atlas, Azure CosmosDB, AWS DocumentDB, GCP Firestore, Custom MongoDB Server.

{% hint style="warning" %}
**Warning**: the setup in this document is possible with `Storage Class`.
{% endhint %}

The `oobeya-ui` service and its `init containers` must be run using a dedicated `Service Account` within the OpenShift environment due to their operational requirements. The necessary security permissions must be assigned to this Service Account. These elevated permissions are restricted solely to the required components, while all other pods continue to operate under the default security policies.

{% hint style="info" %}
**Note**: The Ingress object is used to access the application interface and is specified in the `route.yml` file. You need to change your DNS settings.
{% endhint %}

***

### Installation Steps

* Please switch to the oobeya project.
* If it doesn't exist, please create a namespace for Oobeya.

```
$ oc create namespace oobeya
```

* Request a token from the Oobeya team for registry access.

```
$ oc secret docker-registry oobeya-secret \
      --docker-server=https://oobeya.azurecr.io \
      --docker-username=(Credentials-Name) \
      --docker-password=(Your-Credentials) --namespace=oobeya
```

* You can download the Manifest files.

```
$ wget https://oobeya-app.s3.us-east-1.amazonaws.com/oobeya-oc-install.tar
```

```
$ tar -xvf oobeya-oc-install.tar && cd oobeya
```

### Configuration

* PVCs are given in `oobeya-mongo.yml` Enter the StorageClass name.
* To access Oobeya from the browser, you need to add the domain name or machine IP to the configuration.

```
$ vi (pwd)/configmaps.yml
```

Please edit this:

1. dashboard-configmap

```
CORS_ALLOWED_ORIGIN: "http://your-IP-or-Domain"
```

2. gateway-configmap

```
CORS_ALLOWED_ORIGIN: "http://your-IP-or-Domain"
OOBEYA_GATEWAY_BASE_URL: "http://your-IP-or-Domain"
```

### Deployment

You can run this command.

```
$ oc apply -f .
```

* By default, Oobeya broadcasts on port 80.
* When all services are '1/1 Running,' you can access Oobeya through your browser at '<http://your-IP-or-Domain>'.


# Integration Catalog

See all documented integrations here.

Connect Oobeya to the tools your engineering organization already uses across the software development lifecycle.

Oobeya supports **40+ integrations across 7 categories**, bringing development, delivery, planning, quality, testing, production, documentation, identity, and AI-assisted development data into a unified engineering intelligence platform.

### Integration Categories

<table data-header-hidden data-search="false"><thead><tr><th width="276.88946533203125">Category</th><th>What Oobeya Collects</th></tr></thead><tbody><tr><td><strong>Project Management &#x26; Documentation</strong></td><td>Work items, sprints, backlogs, boards, workflow activity, and documentation metadata</td></tr><tr><td><strong>SCM &#x26; CI/CD</strong></td><td>Commits, branches, pull requests, reviews, pipelines, builds, releases, and deployments</td></tr><tr><td><strong>AI Coding Assistants &#x26; Attribution</strong></td><td>AI-assisted coding adoption, attribution, acceptance rates, and productivity impact</td></tr><tr><td><strong>Quality &#x26; Security</strong></td><td>Bugs, vulnerabilities, code smells, technical debt, coverage, and security findings</td></tr><tr><td><strong>Test Management</strong></td><td>Test executions, test results, automation, UAT, and defect-related signals</td></tr><tr><td><strong>Monitoring / APM</strong></td><td>Incidents, errors, application performance, and production reliability signals</td></tr><tr><td><strong>SSO &#x26; Identity</strong></td><td>Authentication, user provisioning, directory synchronization, and identity management</td></tr></tbody></table>

### Integration List

<table data-full-width="false"><thead><tr><th width="233">Tool</th><th width="208">Categories</th><th>Modules</th><th>Plan</th></tr></thead><tbody><tr><td>GitHub Copilot</td><td>AI Coding Assistant</td><td>All</td><td>All</td></tr><tr><td>Cursor</td><td>AI Coding Assistant</td><td>All</td><td>All</td></tr><tr><td>Claude Code</td><td>AI Coding Assistant</td><td>All</td><td>All</td></tr><tr><td><a href="https://blamely.ai/docs/welcome">Blamely AI</a> <em>(backed by Oobeya)</em></td><td>AI Code Attribution</td><td>All</td><td>All</td></tr><tr><td>Git AI</td><td>AI Code Attribution</td><td>All</td><td>All</td></tr><tr><td><a href="/integrations/all-integrations/project-management-addons/jira-cloud-integration">Jira Cloud</a></td><td>Project Management</td><td>All</td><td>Cloud</td></tr><tr><td><a href="/integrations/all-integrations/project-management-addons/jira-server-integration">Jira Server / Data Center</a></td><td>Project Management</td><td>All</td><td>Server, Data Center</td></tr><tr><td>Confluence</td><td>Documentation</td><td>All</td><td>Server, Data Center</td></tr><tr><td><a href="/integrations/all-integrations/scm-addons/azure-devops-integration">Azure DevOps</a></td><td>SCM &#x26; CI/CD &#x26; Project Management</td><td>Repos, Azure Boards, Pipelines, Releases</td><td>Cloud, Server</td></tr><tr><td><a href="/integrations/all-integrations/scm-addons/github-integrations">GitHub</a></td><td>SCM &#x26; CI/CD</td><td>Repos, GitHub Actions</td><td>Cloud, Enterprise Cloud, Enterprise On-premise</td></tr><tr><td><a href="/integrations/all-integrations/scm-addons/gitlab-addon">GitLab</a></td><td>SCM &#x26; CI/CD</td><td>Repos, GitLab CI</td><td>Cloud, Self Managed, Enterprise</td></tr><tr><td><a href="/integrations/all-integrations/scm-addons/bitbucket-cloud-integration">Bitbucket Cloud</a></td><td>SCM &#x26; CI/CD</td><td>Repos, Bitbucket Pipelines</td><td>Cloud</td></tr><tr><td><a href="/integrations/all-integrations/scm-addons/bitbucket-server-integration">Bitbucket Server / Data Center</a></td><td>SCM</td><td>Repos</td><td>Server, Data Center</td></tr><tr><td><a href="/integrations/all-integrations/scm-addons/gitea-integration">Gitea</a></td><td>SCM</td><td>Repos</td><td>Server</td></tr><tr><td><a href="/integrations/all-integrations/scm-addons/gerrit-integration">Gerrit</a></td><td>SCM </td><td>All</td><td>Cloud, Server</td></tr><tr><td>ArgoCD</td><td>CI/CD</td><td>All</td><td>Server</td></tr><tr><td><a href="/integrations/all-integrations/scm-addons/jenkins-integration">Jenkins</a></td><td>CI/CD</td><td>All</td><td>Server</td></tr><tr><td>Cloudbees</td><td>CI/CD</td><td>All</td><td>Server</td></tr><tr><td><a href="/integrations/all-integrations/scm-addons/teamcity-integration">TeamCity</a></td><td>CI/CD</td><td>All</td><td>Cloud, Server</td></tr><tr><td><a href="/integrations/all-integrations/scm-addons/octopus-deploy-integration">Octopus Deploy</a></td><td>CI/CD</td><td>All</td><td>Cloud, Server</td></tr><tr><td><a href="/integrations/all-integrations/code-quality-addons/sonarqube-integration">SonarQube Server</a></td><td>Quality &#x26; Security</td><td>All</td><td>Server</td></tr><tr><td><a href="https://docs.oobeya.io/integrations/all-integrations/code-quality-addons/sonarqube-cloud-integration">SonarQube Cloud</a></td><td>Quality &#x26; Security</td><td>All</td><td>Cloud</td></tr><tr><td>Fortify</td><td>Quality &#x26; Security</td><td>All</td><td>Server</td></tr><tr><td><a href="/integrations/all-integrations/code-quality-addons/veracode-integration">Veracode</a></td><td>Quality &#x26; Security</td><td>SAST</td><td>Cloud</td></tr><tr><td><a href="/integrations/all-integrations/code-quality-addons/xray-integration">Xray</a> (for Jira)</td><td>Quality &#x26; Security</td><td>All</td><td>Cloud, Server / DC</td></tr><tr><td><a href="/integrations/all-integrations/apm-monitoring-addons/azure-application-insights-integration">Azure Application Insights</a></td><td>Monitoring &#x26; APM</td><td>APM</td><td>Cloud</td></tr><tr><td><a href="/integrations/all-integrations/apm-monitoring-addons/new-relic-integration">New Relic</a></td><td>Monitoring &#x26; APM</td><td>APM, Incident Management</td><td>Cloud</td></tr><tr><td>Datadog (Beta)</td><td>Monitoring &#x26; APM</td><td>APM, Incident Management</td><td>Cloud</td></tr><tr><td><a href="/administration/user-management-single-sign-on-auth-settings/azure-ad-integration">Microsoft Entra (Azure AD)</a></td><td>Authentication</td><td>SSO</td><td>-</td></tr><tr><td>Okta (SAML)</td><td>Authentication</td><td>SSO</td><td>-</td></tr><tr><td><a href="/administration/user-management-single-sign-on-auth-settings/configuring-ldap-active-directory">LDAP</a></td><td>Authentication</td><td>SSO</td><td>-</td></tr></tbody></table>

***

## How Oobeya Integrations Work

Most Oobeya integrations follow the same basic setup flow.

### 1. Install the Add-on

Navigate to **Integrations** and install the add-on for the tool you want to connect.

[Learn how to install an add-on](https://docs.oobeya.io/integrations/adding-new-integration/installing-an-addon).

### 2. Create a Data Source

Navigate to **Data Sources**, select the installed integration, and enter the required connection information.

Depending on the platform, this may include:

* Server URL
* Organization or workspace
* API token
* Personal Access Token
* Application credentials
* Client ID and secret

[Learn how to add a data source](https://docs.oobeya.io/integrations/adding-new-integration/adding-a-new-data-source).

### 3. Test the Connection

Use **Test Connection** to verify that Oobeya can access the connected platform.

***

## Need Another Integration?

Engineering toolchains differ across organizations.

If a tool you use is not currently listed, contact your Oobeya representative or Customer Success team with:

* Tool name
* Product edition and version
* Cloud or self-managed deployment
* Primary use case
* Required Oobeya analytics
* Available API documentation
* Network or security constraints

Integration requests can be evaluated based on the available APIs and the engineering use case.

***

### Visit Oobeya's blog post to learn more about integrations

{% embed url="<https://oobeya.io/blog/achieving-seamless-integration-connecting-your-tools-with-oobeya/>" %}


# SCM (Git) & CI/CD

Learn how you can integrate your SCM & CI/CD tools with Oobeya.

![Oobeya Integrations | SCM & CI/CD Addons](https://3582076375-files.gitbook.io/~/files/v0/b/gitbook-x-prod.appspot.com/o/spaces%2F-MGIlBSTjQtZxUoFwUx4%2Fuploads%2F8ZwNfO7eVcq1LqFcrPPA%2FScreenshot%202024-12-13%20at%2012.05.28.png?alt=media\&token=30f25079-7736-456d-9a16-97feea84e865)

{% content-ref url="/pages/-MGNJpbG4u4kLeyawJ7P" %}
[Azure DevOps Integration](/integrations/all-integrations/scm-addons/azure-devops-integration)
{% endcontent-ref %}

{% content-ref url="/pages/-MGNMx6pdSDMJhDaBL9G" %}
[Bitbucket Cloud Integration](/integrations/all-integrations/scm-addons/bitbucket-cloud-integration)
{% endcontent-ref %}

{% content-ref url="/pages/-MGNNZvn\_p0WvwIIodrl" %}
[Bitbucket Server Integration](/integrations/all-integrations/scm-addons/bitbucket-server-integration)
{% endcontent-ref %}

{% content-ref url="/pages/-MGIoQES-eqgayQN1fw\_" %}
[GitHub Integration](/integrations/all-integrations/scm-addons/github-integrations)
{% endcontent-ref %}

{% content-ref url="/pages/-MGIo\_TjgkkDsesCaduB" %}
[GitLab Integration](/integrations/all-integrations/scm-addons/gitlab-addon)
{% endcontent-ref %}

{% content-ref url="/pages/-MGNSVYodKqfeXTUUFbL" %}
[Jenkins & Cloudbees Integration](/integrations/all-integrations/scm-addons/jenkins-integration)
{% endcontent-ref %}

{% content-ref url="/pages/kU0GotOn57oJlLsu9TmI" %}
[Octopus Deploy Integration](/integrations/all-integrations/scm-addons/octopus-deploy-integration)
{% endcontent-ref %}

{% content-ref url="/pages/vBzgDXBhrT45znKS5YBr" %}
[TeamCity Integration](/integrations/all-integrations/scm-addons/teamcity-integration)
{% endcontent-ref %}

{% content-ref url="/pages/PeywHBdhla7EU34mcZ0y" %}
[Gerrit Integration](/integrations/all-integrations/scm-addons/gerrit-integration)
{% endcontent-ref %}


# GitHub Enterprise Integration

Learn about GitHub Enterprise & Oobeya integration...


# Azure DevOps Integration

Learn about Azure DevOps & Oobeya integration.

{% hint style="info" %}
Oobeya **Azure DevOps addon** is compatible with both Azure DevOps Services (cloud) and Azure DevOps Server (TFS2017, TFS2018, TFS2019).
{% endhint %}

## **1. Create Azure DevOps Personal Access Token**

1\. Navigate to **User Settings** and click **"Personal Access Tokens"**.&#x20;

![](https://firebasestorage.googleapis.com/v0/b/gitbook-x-prod.appspot.com/o/spaces%2F-MGIlBSTjQtZxUoFwUx4%2Fuploads%2FhmDVE5PtAmUpx0mUOg2i%2Ffile.png?alt=media)

2\. Click the ***"New Token"*** button and select ***read*** permissions for the connection.&#x20;

The required permissions are:

* Build – *Read*
* Code – *Read*&#x20;
* Project and Team – *Read*&#x20;
* Pull Request Threads – *Read*
* Release – *Read*
* Test Management – *Read*&#x20;
* Work Items – *Read*&#x20;

![](https://firebasestorage.googleapis.com/v0/b/gitbook-x-prod.appspot.com/o/spaces%2F-MGIlBSTjQtZxUoFwUx4%2Fuploads%2FnK8bOYmMxQfrGHpgDJbL%2Ffile.png?alt=media)

3\. Copy and save the *access token* to use it on the Oobeya data source connection.

## **2. Install Azure DevOps Addon on Oobeya** :jigsaw:&#x20;

1. Log in to [Oobeya](https://oobeya.io/) with an *Administrator* account.
2. Navigate to **Integrations** and select the **Azure DevOps** addon and then click the **"Install"** button.&#x20;

![](https://3582076375-files.gitbook.io/~/files/v0/b/gitbook-x-prod.appspot.com/o/spaces%2F-MGIlBSTjQtZxUoFwUx4%2Fuploads%2FlpPez5GJHWlYExa8WnX4%2FScreenshot%202024-12-13%20at%2016.33.15.png?alt=media\&token=3af0c599-dc16-4a9c-b0ed-6ee720b12f9c)

## **3. Add A New Data Source** :electric\_plug:&#x20;

1.Navigate to **Data Sources**, select Azure DevOps to add a new data source.&#x20;

![](https://firebasestorage.googleapis.com/v0/b/gitbook-x-prod.appspot.com/o/spaces%2F-MGIlBSTjQtZxUoFwUx4%2Fuploads%2FXV9PrLMKFQrLNfJNFUwl%2Ffile.png?alt=media)

2\. Click the **"New Data Source"** button and fill in the form using the Personal *Access Token* which was created on Azure DevOps settings in the first step.&#x20;

**Data Source Name:** A custom name for your data source (e.g., "Oobeya Azure Data Source").&#x20;

**Server URL:** Your Azure DevOps organization’s URL (e.g., <https://dev.azure.com/{your-organization})&#x20>;

**Token:** The Personal Access Token you retrieved earlier.

<figure><img src="https://3582076375-files.gitbook.io/~/files/v0/b/gitbook-x-prod.appspot.com/o/spaces%2F-MGIlBSTjQtZxUoFwUx4%2Fuploads%2FWMjzEK5n4zCkv2X3bxK9%2Fimage.png?alt=media&amp;token=88ca0d3a-3b42-4028-be34-2ba18f4eccd9" alt=""><figcaption></figcaption></figure>

3\. Click the **"Test Connection"** button to verify the connection.

## **Ready to Connect** :rocket:&#x20;

Now Oobeya is connected with your own Azure DevOps to get the real-time statistics of your code repositories to track each development activity.

## **Next Steps** :dart:&#x20;

* [Network Access Requirements ](/integrations/network-access-requirements)
* [Create a new Gitwiser Analysis](/gitwiser-repo-analytics/settings-for-git-analytics/initialize-development-analytics)


# Bitbucket Cloud Integration

Learn about Bitbucket Cloud & Oobeya integration.

## 1. **Create an Atlassian API token**

1. Navigate to [Atlassian Account – Security → API tokens](https://id.atlassian.com/manage-profile/security/api-tokens).&#x20;
2. Click **Create API token with scopes**.

<figure><img src="https://3582076375-files.gitbook.io/~/files/v0/b/gitbook-x-prod.appspot.com/o/spaces%2F-MGIlBSTjQtZxUoFwUx4%2Fuploads%2Fh524BlARiZzZyGDnDJl7%2Fimage.png?alt=media&amp;token=a82214e4-6212-4fe9-a397-4740cd218de3" alt=""><figcaption></figcaption></figure>

3. Name your token and choose an expiration date.

<figure><img src="https://3582076375-files.gitbook.io/~/files/v0/b/gitbook-x-prod.appspot.com/o/spaces%2F-MGIlBSTjQtZxUoFwUx4%2Fuploads%2FBpqZbCdKsrmw3d7BGVpY%2Fimage.png?alt=media&amp;token=6778f45a-b488-458b-b133-dfec6697c9de" alt=""><figcaption></figcaption></figure>

4. Select Bitbucket from the app list.

<figure><img src="https://3582076375-files.gitbook.io/~/files/v0/b/gitbook-x-prod.appspot.com/o/spaces%2F-MGIlBSTjQtZxUoFwUx4%2Fuploads%2FseoUs61pNEUTvc8L2g4T%2Fimage.png?alt=media&amp;token=4498ea9b-1563-484c-a32f-645fd3d15025" alt=""><figcaption></figcaption></figure>

5. Select the scopes as shown below:<br>

<figure><img src="https://3582076375-files.gitbook.io/~/files/v0/b/gitbook-x-prod.appspot.com/o/spaces%2F-MGIlBSTjQtZxUoFwUx4%2Fuploads%2FZw5lo2mvHEu6kpIvBf1z%2Fimage.png?alt=media&amp;token=bf6dbe96-78b6-448c-81ec-c755d97d81ec" alt=""><figcaption></figcaption></figure>

6. Review the token and complete the token creation process.

## **2. Install Bitbucket Cloud Addon on Oobeya** :jigsaw:&#x20;

1. Log in to Oobeya with an *Administrator* account.
2. Navigate to **Integrations** and select the **Bitbucket Cloud** addon and then click the **"Install"** button.&#x20;

![](https://3582076375-files.gitbook.io/~/files/v0/b/gitbook-x-prod.appspot.com/o/spaces%2F-MGIlBSTjQtZxUoFwUx4%2Fuploads%2FiWUd4zkEzp4eC4INBo6p%2FScreenshot%202024-12-17%20at%2011.02.58.png?alt=media\&token=e5ef7d4c-e6c6-4cc1-8eb0-34dd0820a5af)

## **3. Add A New Data Source** :electric\_plug:&#x20;

1\. Navigate to **Data Sources**, and select Bitbucket Cloud to add a new data source.&#x20;

![](https://firebasestorage.googleapis.com/v0/b/gitbook-x-prod.appspot.com/o/spaces%2F-MGIlBSTjQtZxUoFwUx4%2Fuploads%2FR6StYegMSpYq1AvucXED%2Ffile.png?alt=media)

2\. Click the **"New Data Source"** button and fill in the form by using the *API Token (instead of the App Password, which will be changed in the next release),* which was generated on Bitbucket Cloud in the first step.&#x20;

**Data Source Name:** A custom name for your data source (e.g., "Bitbucket Cloud").&#x20;

**Username:** E-mail account used for Atlassian.

**App Password:** API Token created in the previous steps.

**Workspace:** Your workspace on Bitbucket Cloud.

<figure><img src="https://3582076375-files.gitbook.io/~/files/v0/b/gitbook-x-prod.appspot.com/o/spaces%2F-MGIlBSTjQtZxUoFwUx4%2Fuploads%2FYyIGfAYI8ySsSXnYoDSh%2Fimage.png?alt=media&amp;token=b04f67d4-53ed-4dea-81a4-659ff9652f50" alt=""><figcaption></figcaption></figure>

3\. Click the **"Test Connection"** button to verify the connection.

## **Ready to Connect** :rocket:&#x20;

Now Oobeya is connected with your own Bitbucket Cloud account to get the real-time statistics of your code repositories to track each development activity.

## **Next Steps** :dart:&#x20;

* [Network Access Requirements ](/integrations/network-access-requirements)
* [Create a new Gitwiser Analysis](/gitwiser-repo-analytics/settings-for-git-analytics/initialize-development-analytics)


# Bitbucket Server Integration

Learn about Bitbucket Server & Oobeya integration.

## 1. **Install Bitbucket Addon on Oobeya** :jigsaw:&#x20;

1. Log in to Oobeya with an *Administrator* account.
2. Navigate to **Integrations** and select the **Bitbucket** addon and then click the **"Install"** button.

![](https://3582076375-files.gitbook.io/~/files/v0/b/gitbook-x-prod.appspot.com/o/spaces%2F-MGIlBSTjQtZxUoFwUx4%2Fuploads%2FiJD2bLC5in2sQX67qBtV%2FScreenshot%202024-12-17%20at%2011.07.07.png?alt=media\&token=0cf7c0f0-e543-4765-a926-5172c717281e)

## **2. Add A New Data Source**:electric\_plug:&#x20;

1\. Navigate to **Data Sources**, and select Bitbucket to add a new data source.&#x20;

![](https://firebasestorage.googleapis.com/v0/b/gitbook-x-prod.appspot.com/o/spaces%2F-MGIlBSTjQtZxUoFwUx4%2Fuploads%2F0w59U3BV44Qt72aL24uj%2Ffile.png?alt=media)

2\. Click the "New Data Source" button and fill in the form using your Bitbucket credentials.

**Data Source Name:** A custom name for your data source (e.g., "Bitbucket").&#x20;

**Server URL:** Your Bitbucket server’s URL (e.g., <https://bitbucket.mydomain.com).&#x20>;

**Username:** The username you use to log in to Bitbucket.&#x20;

Password: Your Bitbucket account password.

![](https://firebasestorage.googleapis.com/v0/b/gitbook-x-prod.appspot.com/o/spaces%2F-MGIlBSTjQtZxUoFwUx4%2Fuploads%2FDUaZ0mo1RtntsW9oAosf%2Ffile.png?alt=media)

3\. Click the **"Test Connection"** button to verify the connection.

## **Ready to Connect** :rocket:&#x20;

Now Oobeya is connected with your own Bitbucket Server to get the real-time statistics of your code repositories to track each development activity.

## **Next Steps** :dart:&#x20;

* [Network Access Requirements ](/integrations/network-access-requirements)
* [Create a new Gitwiser Analysis](/gitwiser-repo-analytics/settings-for-git-analytics/initialize-development-analytics)


# GitHub Integration

Learn about GitHub & Oobeya integration.

There four options to integrate [Oobeya](https://oobeya.io) with [GitHub](https://github.com).&#x20;

1. **Option 1:** [Use a Personal Access Token](#id-1.-generate-github-personal-access-token)
2. **Option 2:** [Use the official Oobeya GitHub App from the GitHub Marketplace. ](/integrations/all-integrations/scm-addons/step-by-step-integration-instructions-for-the-oobeya-github-application#option-1-using-the-official-oobeya-github-app)
3. **Option 3:** [Register your own GitHub application.](/integrations/all-integrations/scm-addons/step-by-step-integration-instructions-for-the-oobeya-github-application#option-2-registering-your-own-github-application)
4. **Option 4:** [Use a GitHub App Installation Token](/integrations/all-integrations/scm-addons/step-by-step-integration-instructions-for-the-oobeya-github-application#option-3-using-a-github-app-installation-token)

***

## 1. G**enerate GitHub Personal Access Token**

1. Navigate to GitHub **Settings** and click the **"Developer Settings"** tab.
2. Select the **"Personal access tokens"** tab, **"Tokens (classic)"**, **"Generate new token"** and **"Generate new token (classic)"** button. Select ***read*** permissions for the connection.

<figure><img src="https://3582076375-files.gitbook.io/~/files/v0/b/gitbook-x-prod.appspot.com/o/spaces%2F-MGIlBSTjQtZxUoFwUx4%2Fuploads%2FvosP09HxDNgGsCaaPycR%2Fimage.png?alt=media&amp;token=dd1e8a24-dad5-41eb-86da-6784fc84200a" alt=""><figcaption></figcaption></figure>

<figure><img src="https://3582076375-files.gitbook.io/~/files/v0/b/gitbook-x-prod.appspot.com/o/spaces%2F-MGIlBSTjQtZxUoFwUx4%2Fuploads%2Fj1kzOV1BSuBZJcHtJS17%2Fimage.png?alt=media&amp;token=9d49c588-fba0-4c81-9110-9ab6d64e81be" alt=""><figcaption></figcaption></figure>

&#x20; 3\. Copy and save the ***access token*** to use it on the Oobeya data source connection.

## **2. Install GitHub Addon on Oobeya** :jigsaw:&#x20;

1. Log in to Oobeya with an *Administrator* account.
2. Navigate to **Integrations** and select the **GitHub** addon. Then click the **"Install"** button.

![](https://3582076375-files.gitbook.io/~/files/v0/b/gitbook-x-prod.appspot.com/o/spaces%2F-MGIlBSTjQtZxUoFwUx4%2Fuploads%2FmX4AB1xGQWDL4nWpibj5%2FScreenshot%202024-12-17%20at%2011.14.44.png?alt=media\&token=1e355530-444e-4fb6-b0a6-d80d045fd9e5)

## **3. Add A New Data Source** :electric\_plug:&#x20;

1. Navigate to **Data Sources** and select GitHub to add a new data source.&#x20;

![](https://firebasestorage.googleapis.com/v0/b/gitbook-x-prod.appspot.com/o/spaces%2F-MGIlBSTjQtZxUoFwUx4%2Fuploads%2FMdy8XkdBBN0iRNS6u2Fr%2Ffile.png?alt=media)

2\. Click the **"New Data Source"** button and fill in the form using the *Access Token* created on GitHub settings in the first step.

![](https://firebasestorage.googleapis.com/v0/b/gitbook-x-prod.appspot.com/o/spaces%2F-MGIlBSTjQtZxUoFwUx4%2Fuploads%2Fgq76eb9TWJSqFZegBdvJ%2Ffile.png?alt=media)

3\. Click the **"Test Connection"** button to verify the connection.

## **Ready to Connect** :rocket:&#x20;

Following these steps, you can integrate the Oobeya seamlessly with your GitHub account, enhancing your development workflow with insightful metrics and data such as [DORA metrics](https://oobeya.io/dora-metrics-four-key/) and [pull request metrics](https://oobeya.io/oobeya-metric-definitions/).

## **Next Steps** :dart:&#x20;

* [Network Access Requirements ](/integrations/network-access-requirements)
* [Create a new Gitwiser Analysis](/gitwiser-repo-analytics/settings-for-git-analytics/initialize-development-analytics)


# Step-by-Step Integration Instructions for the Oobeya GitHub Application

## **Option 1:** Using the Official Oobeya GitHub App&#x20;

Utilize the[ official Oobeya GitHub App ](https://github.com/marketplace/oobeya-dora-metrics)available on the GitHub Marketplace to seamlessly integrate [Oobeya](https://oobeya.io) with your GitHub repositories and workflows. Simply install the application from the GitHub App Marketplace, grant the necessary permissions, and select the Oobeya GitHub App option when [creating a data source](/integrations/adding-new-integration/adding-a-new-data-source) within Oobeya. This straightforward approach ensures smooth integration and access to [Oobeya's features](https://oobeya.io/oobeya-metric-definitions/). See the step-by-step integration guide below:

### Step 1: Install the Oobeya GitHub App

1. Go to the [Oobeya DORA Metrics GitHub App Marketplace page ](https://github.com/marketplace/oobeya-dora-metrics)and install the application.&#x20;
2. You will be prompted to choose which repositories to integrate with Oobeya. You can select all repositories or choose specific ones.
3. After selecting the repositories, grant the necessary permissions requested by Oobeya.<br>

   <figure><img src="https://3582076375-files.gitbook.io/~/files/v0/b/gitbook-x-prod.appspot.com/o/spaces%2F-MGIlBSTjQtZxUoFwUx4%2Fuploads%2FZjf4xjpY115618pitdEp%2Fimage.png?alt=media&amp;token=a3748751-d70c-4514-a48a-16bc37fee897" alt=""><figcaption><p>Oobeya DORA Metrics GitHub Application<br></p></figcaption></figure>

### Step 2: Create a Data Source in Oobeya

1. Navigate to the Oobeya **Data Sources** page. Look for the GitHub integration and select it.
2. When [adding the data source](/integrations/adding-new-integration/adding-a-new-data-source) in Oobeya, select "Oobeya GitHub App" as the "version".<br>

   <figure><img src="https://3582076375-files.gitbook.io/~/files/v0/b/gitbook-x-prod.appspot.com/o/spaces%2F-MGIlBSTjQtZxUoFwUx4%2Fuploads%2FpE9swylilIS5xtExUsIw%2Fimage.png?alt=media&amp;token=3c3a52d2-dd32-4060-994e-15a5d88227f2" alt="" width="334"><figcaption><p>Select Oobeya GitHub App</p></figcaption></figure>
3. Enter the name of the data source.
4. Click the "Request GitHub Permission" button.
5. Grant the required permissions on the GitHub website. Then you'll be redirected to the Oobeya screen.<br>

   <figure><img src="https://3582076375-files.gitbook.io/~/files/v0/b/gitbook-x-prod.appspot.com/o/spaces%2F-MGIlBSTjQtZxUoFwUx4%2Fuploads%2FtqlwNJUd96bXoCB2mw4P%2Fimage.png?alt=media&amp;token=43b059ba-754d-4c41-a94e-eb0d1ef00663" alt="" width="563"><figcaption></figcaption></figure>
6. Select the newly created data source from the list and click the "Test Connection" button to see if it works properly.<br>

   <figure><img src="https://3582076375-files.gitbook.io/~/files/v0/b/gitbook-x-prod.appspot.com/o/spaces%2F-MGIlBSTjQtZxUoFwUx4%2Fuploads%2Fd1jsskEcZb0brVHq4BHk%2Fimage.png?alt=media&amp;token=deeb0ab2-f7c0-44e0-bb7c-c4ffd2386bed" alt="" width="332"><figcaption><p>Test Connection</p></figcaption></figure>

***

## **Option 2:** Registering Your Own GitHub Application

Register your own GitHub Application to integrate with Oobeya for more flexibility and customization. By creating your own GitHub App, you can tailor the integration to suit your specific requirements and preferences. Navigate to your GitHub account settings, register a new GitHub App, configure the required permissions, and specify the Client ID and Client Secret within the Oobeya data source settings. This option offers greater control over the integration process, allowing you to manage the connection between Oobeya and GitHub according to your needs. See the step-by-step integration guide below:

### Step 1: Create a New GitHub App

1. Navigate to the **Settings** page on GitHub.
   * To register an application for a **personal account**, click on the "Developer settings" tab.
   * To register an application for an **Organization**, go to the "Organizations" tab from the left menu, then click on the "Settings" button next to the organization name.
2. On the left menu, click on "Developer settings".
3. On the left menu, click on "GitHub Apps".
4. Click on the "New GitHub App" button.
5. Fill in the required fields (GitHub App name, Homepage URL, Callback URL) with your information.
   * For the **Callback URL** field, enter the following URL: {OOBEYA\_DOMAIN}/api/platform/datasources/github \
     (e.g., <https://customer.oobeya.io/api/platform/datasources/github>).
6. Click the "Save Changes" button to save your changes.
7. Open the "Permissions & events" tab from the left menu and select the following permissions as **"Read-only"** for the Actions, Administration, Code, Deployments, Issues, Members, Metadata, Organization Administration, Organization Events, Organization Projects, and Pull Requests.<br>

   <figure><img src="https://3582076375-files.gitbook.io/~/files/v0/b/gitbook-x-prod.appspot.com/o/spaces%2F-MGIlBSTjQtZxUoFwUx4%2Fuploads%2Fo3LtPbSn8woMfnoLR9i7%2Fimage.png?alt=media&amp;token=349fd54c-29de-4753-9956-eef461e3ec11" alt=""><figcaption><p>Permissions for your own GitHub App</p></figcaption></figure>

### Step 2: Integrate the GitHub App with Oobeya

1. Navigate to the Oobeya **Data Sources** page. Look for the GitHub integration and select it.
2. When [adding the data source](/integrations/adding-new-integration/adding-a-new-data-source) for GitHub, select **"GitHub Own GitHub App"** as the "version".
3. Enter the **GitHub App Client ID** and **Client Secret** of the newly registered GitHub application.
4. Finally, click the "Request GitHub Permission" button to add the new data source.<br>

<figure><img src="https://3582076375-files.gitbook.io/~/files/v0/b/gitbook-x-prod.appspot.com/o/spaces%2F-MGIlBSTjQtZxUoFwUx4%2Fuploads%2FLnaO6I3RvqdCZcS2rGtB%2Fimage.png?alt=media&amp;token=d64decfc-fe80-4d62-8798-f812d1f5e84e" alt="" width="329"><figcaption><p>Create your own application on GitHub and register it to Oobeya</p></figcaption></figure>

***

## **Option 3:** Using a GitHub App Installation Token

Integrate Oobeya with GitHub by using an **Installation Token** generated from your own GitHub App. With this option, Oobeya authenticates as the GitHub App installation itself — using the **App ID**, the **Installation ID**, and the App's **private key (.pem)** — instead of an OAuth flow or a user-based Personal Access Token.

This option is recommended when:

* You do not want the integration to depend on a personal user account or a user's Personal Access Token.
* You prefer server-to-server authentication with short-lived tokens that are refreshed automatically.
* Your organization restricts OAuth callback URLs, or your Oobeya instance is not publicly reachable from GitHub.

{% hint style="info" %}
You can use an existing GitHub App or register a new one. If you have already registered your own GitHub App by following [**Option 2**](#option-2-registering-your-own-github-application), you can reuse the same application here — you only need the App ID, the Installation ID, and a private key file.
{% endhint %}

See the step-by-step integration guide below:

***

#### Step 1: Create a New GitHub App (or use an existing one)

1. For this step, follow the same steps mentioned [here](#step-1-create-a-new-github-app).

***

#### Step 2: Get the Application ID

1. Open your GitHub App settings page.
   * Organization app example: `https://github.com/organizations/{ORGANIZATION}/settings/apps/{APP_NAME}`\
     (e.g., <https://github.com/organizations/oobeyaio/settings/apps/oobeya-dora-metrics>).
   * Personal account app: **Settings > Developer settings > GitHub Apps >** click "Edit" next to your app.
2. On the "General" tab, find the **"App ID"** value in the "About" section (e.g., `123456`).,
3. Copy this value; you will enter it into the **Application ID** field in Oobeya.

<figure><img src="https://3582076375-files.gitbook.io/~/files/v0/b/gitbook-x-prod.appspot.com/o/spaces%2F-MGIlBSTjQtZxUoFwUx4%2Fuploads%2FevXZk4zL6m3aYEtgioX9%2Fimage.png?alt=media&amp;token=a409fd52-6749-48ba-98b7-269f3d7dde6e" alt="" width="563"><figcaption></figcaption></figure>

{% hint style="warning" %}
The **App ID** and the **Client ID** are different values. For the Installation Token integration, Oobeya requires the numeric **App ID**, not the Client ID (`Iv1.xxxxxxxx` / `Iv23xxxxxxxx`).
{% endhint %}

***

#### Step 3: Generate a Private Key (.pem)

1. On the GitHub App "General" tab, scroll down to the **"Private keys"** section.
2. Click the "Generate a private key" button.
3. GitHub will automatically download a `.pem` file to your computer. Store this file securely; you will upload it to Oobeya in Step 5.

<figure><img src="https://3582076375-files.gitbook.io/~/files/v0/b/gitbook-x-prod.appspot.com/o/spaces%2F-MGIlBSTjQtZxUoFwUx4%2Fuploads%2FubciYmB2oZbAiQ2G3icl%2Fimage.png?alt=media&amp;token=45cdf182-83e2-4e5b-a393-e8d9da73ff7d" alt="" width="563"><figcaption></figcaption></figure>

{% hint style="info" %}
GitHub shows the private key only once, at the moment it is generated. If the `.pem` file is lost, you cannot download it again — generate a new private key instead. Each generated key is listed with its SHA256 fingerprint and remains valid until you delete it, so it is a good practice to delete the keys you no longer use.
{% endhint %}

***

#### Step 4: Install the GitHub App and Get the Installation ID

1. On your GitHub App settings page, click "Install App" from the left menu, then install the application on your organization or personal account.
2. You will be prompted to choose which repositories to integrate with Oobeya. You can select all repositories or choose specific ones.
3. Open the installation configuration page to read the **Installation ID**:
   * For an **Organization**: **Organization Settings > GitHub Apps >** click "Configure" next to the app.
   * For a **personal account**: **Settings > Applications > Installed GitHub Apps >** click "Configure" next to the app.
4. Check the browser address bar. The last number in the URL is your **Installation ID**:\
   `https://github.com/organizations/{ORGANIZATION}/settings/installations/98765432`\
   In this example, the Installation ID is `98765432`.

***

#### Step 5: Create the Data Source in Oobeya

1. Navigate to the Oobeya **Data Sources** page. Look for the GitHub integration and select it.
2. When adding the data source for GitHub, select **"GitHub Installation Token"** as the "version".
3. Fill in the following fields:
   * **Data Source Name:** A descriptive name for the data source (e.g., `GitHub - Oobeya Org`).
   * **Application ID:** The App ID you copied in Step 2 (e.g., `123456`).
   * **Installation ID:** The Installation ID you copied in Step 4 (e.g., `98765432`).
   * **Private Key (.pem):** Drag and drop the `.pem` file you downloaded in Step 3 into the upload area, or click the area to select the file.
4. Click the "Test Connection" button to verify that the credentials are valid.
5. Once the connection test is successful, click the "Add" button to save the data source.

<figure><img src="https://3582076375-files.gitbook.io/~/files/v0/b/gitbook-x-prod.appspot.com/o/spaces%2F-MGIlBSTjQtZxUoFwUx4%2Fuploads%2FYAZWzkxWikmGc0ovXyEE%2Fimage.png?alt=media&amp;token=45eccb81-fa0b-4d15-a79c-27e1dc7b54e8" alt="" width="338"><figcaption></figcaption></figure>

{% hint style="info" %}
Oobeya uses the App ID and the private key to generate a short-lived installation access token for the given Installation ID, and refreshes it automatically. You do not need to renew any token manually.
{% endhint %}

***

## Troubleshooting

* If you encounter issues with the integration, check the permissions granted during the installation process. Ensure Oobeya has access to the necessary data.
* Consult the Oobeya support documentation or contact the Oobeya support team or your assigned Customer Success Engineer for specific issues related to the Oobeya platform.

***

## **What's Next? 🎯**&#x20;

By following these instructions, you will be able to effortlessly integrate the Oobeya GitHub Application into your Oobeya account. This integration will greatly enhance your development workflow by providing you with valuable metrics and data, including [DORA metrics](https://oobeya.io/dora-metrics-four-key/) and [pull request metrics](https://oobeya.io/oobeya-metric-definitions/).

If you are not using Oobeya, feel free to [contact us](https://oobeya.io/contact/) to learn more about Oobeya GitHub integration and explore Oobeya's powerful DORA Metrics tool.

## **Next Steps** :dart:&#x20;

* [Network Access Requirements ](/integrations/network-access-requirements)
* [Create a new Gitwiser Analysis](/gitwiser-repo-analytics/settings-for-git-analytics/initialize-development-analytics)


# GitLab Integration

Learn about GitLab & Oobeya integration.

## 1. **Create GitLab Access Token**

1. Navigate to GitLab **Settings** and click the **"Access Tokens"** tab.
2. Select ***read*** permissions for the connection and click the **"Create personal access token"** button.&#x20;

![](https://firebasestorage.googleapis.com/v0/b/gitbook-x-prod.appspot.com/o/spaces%2F-MGIlBSTjQtZxUoFwUx4%2Fuploads%2FmbU5bPqLafKgvMjjxiqA%2Ffile.png?alt=media)

3\. Copy and save the *access token* to use on the Oobeya data source connection.

## **2. Install GitLab Addon on Oobeya** :jigsaw:&#x20;

1. Log in to [Oobeya](https://oobeya.io/) with an *Administrator* account.
2. Navigate to **Integrations**, select the GitLab addon, and click the **"Install"** button.&#x20;

![](https://3582076375-files.gitbook.io/~/files/v0/b/gitbook-x-prod.appspot.com/o/spaces%2F-MGIlBSTjQtZxUoFwUx4%2Fuploads%2FzASB8ouj2W7ul1hR2qws%2FScreenshot%202024-12-17%20at%2011.26.05.png?alt=media\&token=7220dbc5-22bb-49a0-9963-e967760946ee)

## **3. Add A New Data Source** :electric\_plug:&#x20;

1\. Navigate to **Data Sources** and select GitLab to add a new data source.&#x20;

![](https://firebasestorage.googleapis.com/v0/b/gitbook-x-prod.appspot.com/o/spaces%2F-MGIlBSTjQtZxUoFwUx4%2Fuploads%2FOypJPor6pJajZFSxmbo0%2Ffile.png?alt=media)

2\. Click the **"New Data Source"** button and fill in the form by using the *Access Token* which was created on GitLab settings in the first step.

![](https://firebasestorage.googleapis.com/v0/b/gitbook-x-prod.appspot.com/o/spaces%2F-MGIlBSTjQtZxUoFwUx4%2Fuploads%2FKV3wdzWFJPls0s56bCZp%2Ffile.png?alt=media)

3\. Click the **"Test Connection"** button to verify the connection.

## **Ready to Connect** :rocket:&#x20;

Now Oobeya is connected with your own GitLab server to get the real-time statistics of your code repositories to track each development activity.

## **Next Steps** :dart:&#x20;

* [Network Access Requirements ](/integrations/network-access-requirements)
* [Create a new Gitwiser Analysis](/gitwiser-repo-analytics/settings-for-git-analytics/initialize-development-analytics)


# Jenkins & Cloudbees Integration

Learn about Jenkins & Oobeya integration.

## 1. **Generate Jenkins API Token**

1\. On Jenkins, open the user dropdown at the top right and click the **"Security"** option.&#x20;

<figure><img src="https://3582076375-files.gitbook.io/~/files/v0/b/gitbook-x-prod.appspot.com/o/spaces%2F-MGIlBSTjQtZxUoFwUx4%2Fuploads%2FOODRGLpChJIq34IeVwWv%2Fimage.png?alt=media&amp;token=2b84d16c-6252-4369-8482-d7845c8bca4b" alt=""><figcaption></figcaption></figure>

2\. Generate a new API Token by clicking "Add new token".

<figure><img src="https://3582076375-files.gitbook.io/~/files/v0/b/gitbook-x-prod.appspot.com/o/spaces%2F-MGIlBSTjQtZxUoFwUx4%2Fuploads%2F5Xti0ppB67xUgS82dYIl%2Fimage.png?alt=media&amp;token=de45d22c-b89d-43ce-bcd4-0e484bf02d5c" alt=""><figcaption></figcaption></figure>

3\. Copy and save the *API Token* to use on the Oobeya data source connection.

## **2. Install Jenkins Addon on Oobeya** :jigsaw:&#x20;

1. Log in to [Oobeya](https://oobeya.io/) with an *Administrator* account.
2. Navigate to **Integrations**, select the Jenkins addon, and click the **"Install"** button.&#x20;

<figure><img src="https://3582076375-files.gitbook.io/~/files/v0/b/gitbook-x-prod.appspot.com/o/spaces%2F-MGIlBSTjQtZxUoFwUx4%2Fuploads%2FBWfPj77KJzKvFITHLc9k%2FScreenshot%202024-12-17%20at%2011.29.17.png?alt=media&amp;token=7aeee9f6-adbc-4f2e-b969-7ab01cc0df60" alt=""><figcaption></figcaption></figure>

## **3. Add A New Data Source** :electric\_plug:&#x20;

1\. Navigate to **Data Sources**, and select Jenkins to add a new data source.&#x20;

![](https://firebasestorage.googleapis.com/v0/b/gitbook-x-prod.appspot.com/o/spaces%2F-MGIlBSTjQtZxUoFwUx4%2Fuploads%2FlPEJ9ZdExRIcbNRLGeMm%2Ffile.png?alt=media)

2\. Click the **"New Data Source"** button and fill in the form by using the *API Token* which was created on Jenkins settings in the first step.&#x20;

![](https://firebasestorage.googleapis.com/v0/b/gitbook-x-prod.appspot.com/o/spaces%2F-MGIlBSTjQtZxUoFwUx4%2Fuploads%2Fv3pOYb7pNqJpxTsUF88b%2Ffile.png?alt=media)

3\. Click the **"Test Connection"** button to verify the connection.

## **Ready to Connect** :rocket:&#x20;

Now Oobeya is connected with your own Jenkins server to monitor the health status of your pipelines and track key metrics such as *time-to-fix, average deployment duration...*

## **Next Steps** :dart:&#x20;

* [Network Access Requirements ](/integrations/network-access-requirements)
* [Create a new Gitwiser Analysis](/gitwiser-repo-analytics/settings-for-git-analytics/initialize-development-analytics)


# Octopus Deploy Integration

Learn about Octopus Deploy & Oobeya Integration. This guide will walk you through the steps required to integrate Octopus Deploy with Oobeya.

### 1. Getting the Integration URL

* Retrieve the base URL for your Octopus Deploy server directly from your browser. This URL is the address shown in the browser's address bar (e.g. `https://<your-octopus-server>`).

***

### 2. Getting the Integration API Key

1. Log in to **Octopus Deploy**.
2. Click on your **profile icon** at the bottom left of the sidebar.
3. Select **My profile** from the menu.

<figure><img src="https://3582076375-files.gitbook.io/~/files/v0/b/gitbook-x-prod.appspot.com/o/spaces%2F-MGIlBSTjQtZxUoFwUx4%2Fuploads%2FMOIxVXYEnVdEBjBNGrd8%2Fimage.png?alt=media&amp;token=4c019514-28fe-4286-b8bb-f6344a14b40a" alt="" width="188"><figcaption></figcaption></figure>

4. On the **My Profile** page, go to the **My API Keys** tab.
5. Click **New API Key** to generate a new API key.
6. Copy the generated key — you will need it to configure the data source in Oobeya.

<figure><img src="https://3582076375-files.gitbook.io/~/files/v0/b/gitbook-x-prod.appspot.com/o/spaces%2F-MGIlBSTjQtZxUoFwUx4%2Fuploads%2Ft0nUDsxxhvYxdATr2yHq%2Fimage.png?alt=media&amp;token=57c812f8-8279-49f3-87d5-184ba972082b" alt=""><figcaption></figcaption></figure>

> **Note:** API keys allow automated tools like Oobeya to connect to Octopus without recording your personal password. Store the key securely, as it will only be shown once.

***

### 3. Navigate to the Data Sources Screen in Oobeya

1. **Log in to Oobeya** with an Administrator account.
2. From the left menu, select **Data Sources**.
3. Choose the relevant category — **SCM & CI/CD** — from the **Categories** panel.
4. Locate **Octopus Deploy** in the list of available data sources.

<figure><img src="https://3582076375-files.gitbook.io/~/files/v0/b/gitbook-x-prod.appspot.com/o/spaces%2F-MGIlBSTjQtZxUoFwUx4%2Fuploads%2FJllEKGRKGXvd7hmPwIYE%2Fimage.png?alt=media&amp;token=604f05f0-0b8c-44e2-9a76-2a03da2a5da0" alt="" width="375"><figcaption></figcaption></figure>

***

### 4. Create Data Source and Test Connection

1. Click on **Octopus Deploy** to open the **Manage Data Sources: Octopus Deploy** window.
2. **Create a new data source**:
   * Select your **Octopus** version from the version dropdown (e.g. Octopus v1).
   * Fill out the form using the URL and API key/token obtained in the previous steps.
   * You can assign any name for the **Data Source Name** field.
3. **Test the connection**:
   * Click the **Test Connection** button to verify the connection with Octopus Deploy.
   * Once you see **Test Connection Succeeded**, click **Add** to save the data source.

<figure><img src="https://3582076375-files.gitbook.io/~/files/v0/b/gitbook-x-prod.appspot.com/o/spaces%2F-MGIlBSTjQtZxUoFwUx4%2Fuploads%2FNMffJz9NvwfWeT5n7epG%2Fimage.png?alt=media&amp;token=f0b18c94-3a7a-41e6-8dd6-90fa5f5a0925" alt="" width="375"><figcaption></figcaption></figure>

***

### Ready to Connect 🐙

Your Oobeya instance is now connected to your Octopus Deploy account. You can begin tracking and analyzing your deployment processes with Oobeya's analysis tools.

### **Ready to Connect** :rocket:&#x20;

Now Oobeya is connected to your own Octopus Deploy account/server to enable you to track accurate DORA metrics calculated by Oobeya Deployment Analytics.

## **Next Steps** :dart:&#x20;

* [Network Access Requirements ](/integrations/network-access-requirements)
* [Create a new Gitwiser Analysis](/gitwiser-repo-analytics/settings-for-git-analytics/initialize-development-analytics)


# TeamCity Integration

Learn about TeamCity & Oobeya integration...

## 1. **Generate** TeamCity **API Token**

1. Open TeamCity and click on the "Profile" button.

<figure><img src="https://3582076375-files.gitbook.io/~/files/v0/b/gitbook-x-prod.appspot.com/o/spaces%2F-MGIlBSTjQtZxUoFwUx4%2Fuploads%2F6QYekXJVV9sNsqKNMz9R%2Fimage.png?alt=media&amp;token=17ecca32-daca-4d42-b5d3-64b059f8d4b0" alt=""><figcaption></figcaption></figure>

&#x20; 2\. Click on the "Access Tokens"  button on the left and then the "Create access token" button.

<figure><img src="https://3582076375-files.gitbook.io/~/files/v0/b/gitbook-x-prod.appspot.com/o/spaces%2F-MGIlBSTjQtZxUoFwUx4%2Fuploads%2Fa9aeKD7BLso14l4irqlc%2Fimage.png?alt=media&amp;token=a6c80abe-cebb-423e-8738-6080ceceddb5" alt=""><figcaption></figcaption></figure>

&#x20; 3\. Give a name to your token and then store it securely.

<figure><img src="https://3582076375-files.gitbook.io/~/files/v0/b/gitbook-x-prod.appspot.com/o/spaces%2F-MGIlBSTjQtZxUoFwUx4%2Fuploads%2FUZ29fPxlatSpMSh4Svxh%2Fimage.png?alt=media&amp;token=b5712b0f-946b-4f37-846c-ac423fd8152b" alt=""><figcaption></figcaption></figure>

## **2. Install TeamCity Addon on Oobeya**

1. &#x20;Log in to [Oobeya](https://oobeya.io/) with an *Administrator* account.
2. Navigate to **Integrations**, select the TeamCity addon, and click the **"Install"** button.&#x20;

<figure><img src="https://3582076375-files.gitbook.io/~/files/v0/b/gitbook-x-prod.appspot.com/o/spaces%2F-MGIlBSTjQtZxUoFwUx4%2Fuploads%2Fa4dOQ4eUVgq4OEm08Lzb%2FScreenshot%202024-12-17%20at%2011.48.19.png?alt=media&amp;token=e778e7a5-dd85-47bb-9067-dfcdb6cf1235" alt=""><figcaption></figcaption></figure>

<figure><img src="https://3582076375-files.gitbook.io/~/files/v0/b/gitbook-x-prod.appspot.com/o/spaces%2F-MGIlBSTjQtZxUoFwUx4%2Fuploads%2FY4rYqtMMYluQ1OGle8bi%2Fimage.png?alt=media&amp;token=01049d22-4c53-4dab-966e-32b35cb00bd1" alt=""><figcaption></figcaption></figure>

## **3. Add A New Data Source**

1\. Navigate to **Data Sources**, and select **TeamCity** to add a new data source.&#x20;

<figure><img src="https://3582076375-files.gitbook.io/~/files/v0/b/gitbook-x-prod.appspot.com/o/spaces%2F-MGIlBSTjQtZxUoFwUx4%2Fuploads%2F04ectuIhXKeeVku4lmjh%2Fimage.png?alt=media&amp;token=c10b1de9-88fd-4582-b830-cd42e2434bac" alt=""><figcaption></figcaption></figure>

2\. Click the **"New Data Source"** button and fill in the form by using the *API Token* which was created on **TeamCity** settings in the first step.&#x20;

<figure><img src="https://3582076375-files.gitbook.io/~/files/v0/b/gitbook-x-prod.appspot.com/o/spaces%2F-MGIlBSTjQtZxUoFwUx4%2Fuploads%2FIrUtUo1sipTTAbtT9KLG%2Fimage.png?alt=media&amp;token=47bc714a-e309-4717-8b62-420a03a83d1e" alt=""><figcaption></figcaption></figure>

3\. Click the **"Test Connection"** button to verify the connection.

## **Ready to Connect** :rocket:&#x20;

Now Oobeya is connected with your own TeamCity server to monitor the health status of your pipelines and track key metrics such as *time-to-fix, average deployment duration*...

## **Next Steps** :dart:&#x20;

* [Network Access Requirements ](/integrations/network-access-requirements)
* [Create a new Gitwiser Analysis](/gitwiser-repo-analytics/settings-for-git-analytics/initialize-development-analytics)


# Gerrit Integration

Learn about Gerrit & Oobeya integration.

This guide provides a step-by-step walkthrough to integrate your **Gerrit** code review system with **Oobeya** to track engineering metrics and DORA analytics.

***

### 1. Create Gerrit HTTP Credentials 🔑

To allow Oobeya to access your Gerrit repositories, you need to generate an HTTP access token.

1. **Access Settings:** Click the user icon in the top-right corner of your Gerrit UI, navigate to **Settings**.
2. **Generate Token:** Open the **"HTTP Credentials"** tab on the left sidebar and click the **"Generate New Password"** button.

<figure><img src="https://3582076375-files.gitbook.io/~/files/v0/b/gitbook-x-prod.appspot.com/o/spaces%2F-MGIlBSTjQtZxUoFwUx4%2Fuploads%2Fz2IpvfG94IG6miv3zkOW%2Fimage.png?alt=media&amp;token=17296043-053b-44f7-8707-d5f955ce912b" alt=""><figcaption></figcaption></figure>

3. **Secure Your Password:** Copy and save the generated password immediately. You will need this for the Oobeya data source configuration.

***

### 2. Install Gerrit Add-on on Oobeya 🧩

Before connecting your data, ensure the Gerrit integration is active in your Oobeya instance.

1. Log in to **Oobeya** with an **Administrator** account.
2. Navigate to **Integrations** from the side menu.
3. Locate the **Gerrit** add-on and click the **"Install"** button.

<figure><img src="https://3582076375-files.gitbook.io/~/files/v0/b/gitbook-x-prod.appspot.com/o/spaces%2F-MGIlBSTjQtZxUoFwUx4%2Fuploads%2FSO4kJYo36b6HpAIBO2WX%2Fimage.png?alt=media&amp;token=18ad960a-0944-4e30-ba35-089ff8e39600" alt=""><figcaption></figcaption></figure>

***

### 3. Add A New Data Source 🔌

Now, connect your Gerrit server to start fetching data.

1. Navigate to **Data Sources** and select **Gerrit** from the SCM & CI/CD category.

<figure><img src="https://3582076375-files.gitbook.io/~/files/v0/b/gitbook-x-prod.appspot.com/o/spaces%2F-MGIlBSTjQtZxUoFwUx4%2Fuploads%2F2nVHekSmJ0srUQkPQjEG%2Fimage.png?alt=media&amp;token=562e0b18-d4ee-4e63-9a83-e86743491003" alt=""><figcaption></figcaption></figure>

2. Click the **"New Data Source"** button and fill in the required fields:

* **Server URL:** Your Gerrit instance URL (e.g., `https://gerrit.yourdomain.com`).
* **Username:** Your Gerrit username.
* **Token:** The **HTTP Password** you generated in Step 1.

<figure><img src="https://3582076375-files.gitbook.io/~/files/v0/b/gitbook-x-prod.appspot.com/o/spaces%2F-MGIlBSTjQtZxUoFwUx4%2Fuploads%2F0oURgmujjsOy2gsEtvTD%2Fimage.png?alt=media&amp;token=04c46646-40bf-4fcb-91be-ba5d832e01e1" alt=""><figcaption></figcaption></figure>

3. Click **"Test Connection"** to verify the credentials.
4. Once verified, click **"Add"** to finalize the setup.

***

### Ready to Connect 🚀

**Congratulations!** Oobeya is now connected to your Gerrit server. It will begin pulling real-time statistics from your repositories to track development velocity, code review cycles, and team performance.

## **Next Steps** :dart:&#x20;

* [Network Access Requirements ](/integrations/network-access-requirements)
* [Create a new Gitwiser Analysis](/gitwiser-repo-analytics/settings-for-git-analytics/initialize-development-analytics)


# Gitea Integration

Learn about Gitea & Oobeya Integration

This guide provides a step-by-step walkthrough to integrate your **Gitea** code review system with **Oobeya** to track engineering metrics and DORA analytics.

***

### 1. Create Gitea Access Tokens 🔑

To allow Oobeya to access your Gitea repositories, you need to generate an access token.

1. **Settings:** Click the user icon in the top-right corner of your Gitea UI, navigate to **Settings**.
2. **Generate Token:** Open the **"HTTP Credentials"** tab on the left sidebar and click the **"Generate New Password"** button.

<figure><img src="https://3582076375-files.gitbook.io/~/files/v0/b/gitbook-x-prod.appspot.com/o/spaces%2F-MGIlBSTjQtZxUoFwUx4%2Fuploads%2FYBG1HWqH2jt6mABtoaJS%2Ffoto1.png?alt=media&amp;token=27304a7d-78db-4195-bec8-db393b948238" alt=""><figcaption></figcaption></figure>

3. **Secure Your Password:** Copy and save the generated password immediately. You will need this for the Oobeya data source configuration.

***

### 2. Install Gitea Add-on on Oobeya 🧩

Before connecting your data, ensure the Gitea integration is active in your Oobeya instance.

1. Log in to **Oobeya** with an **Administrator** account.
2. Navigate to **Integrations** from the side menu.
3. Locate the **Gitea** add-on and click the **"Install"** button.

<figure><img src="https://3582076375-files.gitbook.io/~/files/v0/b/gitbook-x-prod.appspot.com/o/spaces%2F-MGIlBSTjQtZxUoFwUx4%2Fuploads%2FrKJtntTbUOG0oHnNK7rA%2Ffoto2.png?alt=media&amp;token=50e51cf5-c367-435c-9d4f-dd5bce07fb11" alt=""><figcaption></figcaption></figure>

***

### 3. Add A New Data Source 🔌

Now, connect your Gitea server to start fetching data.

1. Navigate to **Data Sources** and select **Gitea** from the SCM & CI/CD category.

<figure><img src="https://3582076375-files.gitbook.io/~/files/v0/b/gitbook-x-prod.appspot.com/o/spaces%2F-MGIlBSTjQtZxUoFwUx4%2Fuploads%2F5T0ncsVms5sFWlz02rwy%2Ffoto3.png?alt=media&amp;token=a9660ef4-4112-4e90-b249-fbe980a8011f" alt=""><figcaption></figcaption></figure>

2. Click the **"New Data Source"** button and fill in the required fields:

* **Server URL:** Your Gitea instance URL (e.g., `https://gitea.yourdomain.com`).
* **Token:** The **Access Token** you generated in Step 1.
* Click **"Test Connection"** to verify the credentials.
* Once verified, click **"Add"** to finalize the setup.

***

### Ready to Connect 🚀

**Congratulations!** Oobeya is now connected to your Gitea server. It will begin pulling real-time statistics from your repositories to track development velocity, code review cycles, and team performance.

## **Next Steps** :dart:&#x20;

* [Network Access Requirements ](/integrations/network-access-requirements)
* [Create a new Gitwiser Analysis](/gitwiser-repo-analytics/settings-for-git-analytics/initialize-development-analytics)


# Quality & Security

Learn about how you can integrate your quality and security tools with Oobeya.

{% content-ref url="/pages/-MGNUdaUq1dXUZQBekEj" %}
[SonarQube Server Integration](/integrations/all-integrations/code-quality-addons/sonarqube-integration)
{% endcontent-ref %}

{% content-ref url="/pages/2KxuhZcgxaM3rCCFKT4q" %}
[SonarQube Cloud Integration](/integrations/all-integrations/code-quality-addons/sonarqube-cloud-integration)
{% endcontent-ref %}

{% content-ref url="/pages/eZFGVM49WC5E0AYRiXX7" %}
[Veracode Integration](/integrations/all-integrations/code-quality-addons/veracode-integration)
{% endcontent-ref %}

{% content-ref url="/pages/SzETFtnSJwEf3eug4PeV" %}
[Xray Integration](/integrations/all-integrations/code-quality-addons/xray-integration)
{% endcontent-ref %}


# SonarQube Server Integration

The Oobeya–Sonar Integration connects SonarQube Server and SonarQube Cloud with Oobeya’s Engineering Intelligence Platform, turning code quality and security data into actionable insights.

Delivering **high-quality software** requires continuous attention to **code reliability, security, and maintainability**. By integrating [**SonarQube Server**](https://www.sonarsource.com/) with [**Oobeya**](https://oobeya.io), your teams gain end-to-end visibility into code quality, technical debt, and maintainability trends — all in one place.

***

### 1. Generate a SonarQube Server User Token&#x20;

A **User Token** allows Oobeya to connect to your SonarQube Server instance and retrieve project data securely.

{% hint style="info" %}
The token creation process has been updated.\
For the official reference, see: [Generating and Using Tokens](https://docs.sonarsource.com/sonarqube-server/user-guide/managing-tokens)
{% endhint %}

#### Steps:

1. Log in to your **SonarQube Server** instance.
2. Click your **user avatar** (top-right corner) → select **My Account** → open the **Security** tab.
3. Under **Generate Tokens**, enter a **token name** (e.g., `oobeya-integration`).
4. Select **"User Token"** as token type.
5. Click **Generate**.
6. Copy and **store the token securely** — it’s shown only once.

{% hint style="info" %}
The token should belong to a user with at least **Browse** access to all relevant projects. For organization-wide visibility, use a user account with **Admin** permissions.
{% endhint %}

<figure><img src="https://3582076375-files.gitbook.io/~/files/v0/b/gitbook-x-prod.appspot.com/o/spaces%2F-MGIlBSTjQtZxUoFwUx4%2Fuploads%2FSRZyeeJAQqMSDZGkNaHa%2Fimage.png?alt=media&amp;token=c1c9bb67-857e-48b6-80c5-21765cf94405" alt=""><figcaption><p>Generating a new user token</p></figcaption></figure>

***

### 2. Install the SonarQube Add-on in Oobeya

1. Log in to Oobeya with an **Administrator** account.
2. Navigate to **Integrations.**
3. Locate **SonarQube Server** and click **Install**.

<figure><img src="https://3582076375-files.gitbook.io/~/files/v0/b/gitbook-x-prod.appspot.com/o/spaces%2F-MGIlBSTjQtZxUoFwUx4%2Fuploads%2FryTDLzDH5jJgMxJKwDAk%2Fimage.png?alt=media&amp;token=d0874e29-2563-4173-8a1e-db01d1318e89" alt="SonarQube Integration"><figcaption><p>SonarQube Server Integration</p></figcaption></figure>

Once installed, the SonarQube Server connector becomes available in your **Data Sources** list.

***

### 3. Add a SonarQube Data Source

1. Go to **Data Sources → SonarQube Server**.
2. Click **New Data Source**.
3. Fill out the form:
   * **Name:** (e.g., `SonarQube – Production`)
   * **Base URL:** Your SonarQube server address (e.g., `https://sonar.company.com`)
   * **User Token:** Paste the token you generated earlier
4. Click **Test Connection** to verify access.

<figure><img src="https://3582076375-files.gitbook.io/~/files/v0/b/gitbook-x-prod.appspot.com/o/spaces%2F-MGIlBSTjQtZxUoFwUx4%2Fuploads%2FSOoKZUv6vaTwUuVvb4iX%2Fimage.png?alt=media&amp;token=c362b609-b413-4efe-9415-570b0246ec25" alt="" width="375"><figcaption><p>Adding a new SonarQube data source</p></figcaption></figure>

***

### 4. Explore Your Code Quality Insights

After integration, Oobeya continuously imports your **SonarQube metrics**, including:

* **Code Quality Issues**
* **Quality Gate Status**
* **Technical Debt**
* **Maintainability, Reliability, and Security Ratings**

You can explore this data in:

* **Dashboards** — for overall visibility

<figure><img src="https://3582076375-files.gitbook.io/~/files/v0/b/gitbook-x-prod.appspot.com/o/spaces%2F-MGIlBSTjQtZxUoFwUx4%2Fuploads%2FJlKQQ2eDGm8eSzqPZ3fX%2Fimage.png?alt=media&amp;token=c7ba2797-1fe6-4aad-bac1-f3ad27476e58" alt=""><figcaption><p>Improved visibility and ownership for better code quality and security</p></figcaption></figure>

* **Organizational, Team, and Individual Scorecards** — to track trends and KPIs

<figure><img src="https://3582076375-files.gitbook.io/~/files/v0/b/gitbook-x-prod.appspot.com/o/spaces%2F-MGIlBSTjQtZxUoFwUx4%2Fuploads%2FsD91TH29lh6Pf6t9y4Ax%2Fimage.png?alt=media&amp;token=2db5cde2-3786-44da-8b68-45d2d6d3a2a7" alt=""><figcaption><p>Sonarqube metrics in Team Scorecards</p></figcaption></figure>

* **Engineering Insights / Symptoms** — to proactively detect unhealthy code practices **-** [*learn more here*](/use-cases/proactive-issue-detection)*.*<br>

<figure><img src="https://3582076375-files.gitbook.io/~/files/v0/b/gitbook-x-prod.appspot.com/o/spaces%2F-MGIlBSTjQtZxUoFwUx4%2Fuploads%2FfHlXLua9Qx96i9VSBnrI%2Fimage.png?alt=media&amp;token=4650bf21-1cf6-4f5a-b075-2449e01444e5" alt=""><figcaption><p>Code Quality Insights: Auto-detected Symptoms</p></figcaption></figure>

* **Gamification -** [*learn more here*](/use-cases/gamification-for-engineering-kpis)*.*

<figure><img src="https://3582076375-files.gitbook.io/~/files/v0/b/gitbook-x-prod.appspot.com/o/spaces%2F-MGIlBSTjQtZxUoFwUx4%2Fuploads%2FjQ8S7p1dE3ISmWzvZimB%2Fimage.png?alt=media&amp;token=e51efeaf-d291-4c48-be9e-c420ceec6e8f" alt=""><figcaption><p>Leveraging gamification to improve code quality</p></figcaption></figure>

***

### 5. Troubleshooting

If your connection test fails or data is missing, review the following checks:

<table><thead><tr><th width="183.75469970703125">Issue</th><th width="195.8480224609375">Possible Cause</th><th>Solution</th></tr></thead><tbody><tr><td><strong>401 Unauthorized</strong></td><td>Invalid or expired token</td><td>Regenerate a valid User Token and update the Data Source.</td></tr><tr><td><strong>Connection Timeout</strong></td><td>Firewall or proxy blocking requests</td><td>Ensure outbound access to your SonarQube server from Oobeya’s network.</td></tr><tr><td><strong>No Projects Found</strong></td><td>Token lacks permissions</td><td>Verify the token user has project “Browse” or “Admin” permissions.</td></tr><tr><td><strong>SSL Error</strong></td><td>Invalid SSL certificate</td><td>Use a valid SSL certificate or enable trusted certificate configuration.</td></tr><tr><td><strong>Data Outdated</strong></td><td>Sync delay or rate limit</td><td>Trigger a manual re-sync or check your SonarQube server performance.</td></tr></tbody></table>

**💬 Still need help?**\
Contact Oobeya Support or reach out to your Customer Success Manager.

***

### Summary: Connect in 5 Steps

<table><thead><tr><th width="83.13421630859375">Step</th><th width="329.26531982421875">Action</th><th>Result</th></tr></thead><tbody><tr><td>1</td><td>Generate a User Token in SonarQube</td><td>Secure authentication</td></tr><tr><td>2</td><td>Install the SonarQube Server Add-on in Oobeya</td><td>Enable integration</td></tr><tr><td>3</td><td>Add a Data Source</td><td>Connect Oobeya to your SonarQube server</td></tr><tr><td>4</td><td>View Dashboards and Scorecards</td><td>Monitor real-time code quality</td></tr></tbody></table>

## **Next Steps** :dart:&#x20;

* [Network Access Requirements ](/integrations/network-access-requirements)
* [Create a new Gitwiser Analysis](/gitwiser-repo-analytics/settings-for-git-analytics/initialize-development-analytics)


# TestRail Integration

Learn about TestRail & Oobeya integration...

## 1. Enable API Setting on TestRail :tools:&#x20;

1. Click "**Administration**" on the right as follows:&#x20;

![](https://firebasestorage.googleapis.com/v0/b/gitbook-x-prod.appspot.com/o/spaces%2F-MGIlBSTjQtZxUoFwUx4%2Fuploads%2FaSlXej5ix51TzSYch3N3%2Ffile.png?alt=media)

2\. Click "**Site Settings**":&#x20;

![](https://firebasestorage.googleapis.com/v0/b/gitbook-x-prod.appspot.com/o/spaces%2F-MGIlBSTjQtZxUoFwUx4%2Fuploads%2Fz4TmtxPdcEDDJQaCnxUa%2Ffile.png?alt=media)

3\. Click to the "**API**" tab, select the "**Enable API**" option, and click the "**Save Settings**" button:&#x20;

![](https://firebasestorage.googleapis.com/v0/b/gitbook-x-prod.appspot.com/o/spaces%2F-MGIlBSTjQtZxUoFwUx4%2Fuploads%2F3OSiFPQeZXve94UaOkC6%2Ffile.png?alt=media)

## 2. Install TestRail Addon on Oobeya :jigsaw:&#x20;

1. Log in to [Oobeya](https://oobeya.io/) with an Administrator account.
2. Navigate to Market Place and select the **TestRail** addon and then click the "**Install**" button.

![](https://firebasestorage.googleapis.com/v0/b/gitbook-x-prod.appspot.com/o/spaces%2F-MGIlBSTjQtZxUoFwUx4%2Fuploads%2FkG1XMaFdpG0ajGdELkYe%2Ffile.png?alt=media)

## 3. Add a New Data Source :electric\_plug:&#x20;

1. Navigate to Data Sources and select **TestRail** to add a new data source.&#x20;

![](https://firebasestorage.googleapis.com/v0/b/gitbook-x-prod.appspot.com/o/spaces%2F-MGIlBSTjQtZxUoFwUx4%2Fuploads%2Fi1eciQEx3n8KfUuyPVad%2Ffile.png?alt=media)

2\. Click the "New Data Source" button and fill in the form as :&#x20;

* **Data Source Name:** You can enter any name for your TestRail Data Source.&#x20;
* **Server URL:** Enter this area (ex: https\://\<yourCompany>.testrail.io).&#x20;
* **Username:** The username that you use to sign in to the TestRail.&#x20;
* **Password:** The password that you use to sign in to the TestRail.&#x20;

![](https://firebasestorage.googleapis.com/v0/b/gitbook-x-prod.appspot.com/o/spaces%2F-MGIlBSTjQtZxUoFwUx4%2Fuploads%2FoEZOkPKVajZVudYrQ2Dg%2Ffile.png?alt=media)

3\. Click the "**Test Connection**" button to verify the connection.&#x20;

## Ready to Connect :rocket:&#x20;

Now Oobeya is connected with your own TestRail Cloud to track & visualize the status of tests with dashboards and reports.&#x20;

## **Next Steps** :dart:&#x20;

* [Add a new Widget](/dashboards/adding-a-new-widget)


# SonarQube Cloud Integration

The Oobeya–Sonar Integration connects SonarQube Server and SonarQube Cloud with Oobeya’s Engineering Intelligence Platform, turning code quality and security data into actionable insights.

Delivering **high-quality software** requires continuous attention to **code reliability, security, and maintainability**. By integrating **SonarQube Cloud** with [**Oobeya**](https://oobeya.io), your teams gain end-to-end visibility into code quality, technical debt, and maintainability trends — all in one place.

***

### 1. Generate a **SonarQube Cloud** Token&#x20;

A **Personal Access Token (PAT)** allows Oobeya to connect to your **SonarQube Cloud** organization securely.

{% hint style="info" %}
The token creation & lifecycle rules are managed in your **SonarQube Cloud** **My Account → Security** page. See **Managing Personal Access Tokens** in the official docs. [docs.sonarsource.com](https://docs.sonarsource.com/sonarqube-cloud/managing-your-account/managing-tokens?utm_source=chatgpt.com)
{% endhint %}

**Steps**

1. Log in to **SonarQube Cloud**.
2. Click your **user avatar** (top-right) → **My Account** → **Security**.
3. In **Tokens**, enter a name (e.g., `oobeya-integration`) and select **Generate**.
4. Copy and **store the token securely** — it’s shown only once.

{% hint style="info" %}
**Good to know:** SonarQube Cloud may automatically remove **inactive tokens** after a period (e.g., 60 days of inactivity). Rotate/renew tokens as needed. [docs.sonarsource.com](https://docs.sonarsource.com/sonarqube-cloud/managing-your-account/managing-tokens?utm_source=chatgpt.com)
{% endhint %}

***

### 2. Find Your Organization Key&#x20;

Oobeya uses the **Organization Key** (not just the display name) to fetch projects from **SonarQube Cloud**.

**Ways to get it**

* From the SonarQube Cloud UI: open your org; the **key** appears in the org page/URL\
  (e.g., `https://sonarcloud.io/organizations/<organization_key>/projects`).&#x20;
* Or go to the org settings page and see/edit the **Organization key**.

***

### 3. Install the **SonarQube Cloud** Add-on in Oobeya&#x20;

1. Log in to **Oobeya** with an **Administrator** account.
2. Navigate to **Integrations**.
3. Find **SonarQube Cloud** and click **Install**.

***

### 4. Add a New **SonarQube Cloud** Data Source&#x20;

1. Go to **Data Sources → SonarQube Cloud**.
2. Click **New Data Source**.
3. Fill out the form:
   * **Name:** e.g., `SonarQube Cloud – Production`
   * **API Token:** (from Step 1)
   * **Organization Key:** (from Step 2)
4. Click **Test Connection** to verify access.

<figure><img src="https://3582076375-files.gitbook.io/~/files/v0/b/gitbook-x-prod.appspot.com/o/spaces%2F-MGIlBSTjQtZxUoFwUx4%2Fuploads%2FpOY9Pt7YRkiOSeQaClvJ%2Fimage.png?alt=media&amp;token=ccd63740-2cb7-4718-a06e-74fe7c62b03e" alt="" width="375"><figcaption></figcaption></figure>

***

### 5. Explore Your Code Quality Insights&#x20;

After integration, Oobeya continuously imports your **SonarQube Cloud metrics**, including:

* **Issues:** Bugs, Vulnerabilities, Code Smells
* **Quality Gate Status**
* **Technical Debt**
* **Maintainability, Reliability, Security ratings**

View them in:

* **Dashboards** — for portfolio/org visibility

<figure><img src="https://3582076375-files.gitbook.io/~/files/v0/b/gitbook-x-prod.appspot.com/o/spaces%2F-MGIlBSTjQtZxUoFwUx4%2Fuploads%2FJlKQQ2eDGm8eSzqPZ3fX%2Fimage.png?alt=media&amp;token=c7ba2797-1fe6-4aad-bac1-f3ad27476e58" alt=""><figcaption><p>Improved visibility and ownership</p></figcaption></figure>

* **Organizational, Team, and Individual Scorecards** — to track trends & KPIs

<figure><img src="https://3582076375-files.gitbook.io/~/files/v0/b/gitbook-x-prod.appspot.com/o/spaces%2F-MGIlBSTjQtZxUoFwUx4%2Fuploads%2FsD91TH29lh6Pf6t9y4Ax%2Fimage.png?alt=media&amp;token=2db5cde2-3786-44da-8b68-45d2d6d3a2a7" alt=""><figcaption><p>Team Scorecards</p></figcaption></figure>

* **Engineering Insights / Symptoms** — to proactively detect unhealthy practices

<figure><img src="https://3582076375-files.gitbook.io/~/files/v0/b/gitbook-x-prod.appspot.com/o/spaces%2F-MGIlBSTjQtZxUoFwUx4%2Fuploads%2FfHlXLua9Qx96i9VSBnrI%2Fimage.png?alt=media&amp;token=4650bf21-1cf6-4f5a-b075-2449e01444e5" alt=""><figcaption><p>Code Quality Insights: Auto-detected Symptoms</p></figcaption></figure>

* **Gamification** — to drive positive behaviors

<figure><img src="https://3582076375-files.gitbook.io/~/files/v0/b/gitbook-x-prod.appspot.com/o/spaces%2F-MGIlBSTjQtZxUoFwUx4%2Fuploads%2FjQ8S7p1dE3ISmWzvZimB%2Fimage.png?alt=media&amp;token=e51efeaf-d291-4c48-be9e-c420ceec6e8f" alt=""><figcaption><p>Code Quality and Security metrics in gamification</p></figcaption></figure>

***

### 6. Troubleshooting&#x20;

<table><thead><tr><th width="186.00115966796875">Issue</th><th width="209.07318115234375">Possible Cause</th><th>Fix</th></tr></thead><tbody><tr><td><strong>401 Unauthorized</strong></td><td>Invalid/expired token</td><td>Re-generate a valid token in <strong>My Account → Security</strong> and update the data source. <a href="https://docs.sonarsource.com/sonarqube-cloud/managing-your-account/managing-tokens?utm_source=chatgpt.com">docs.sonarsource.com</a></td></tr><tr><td><strong>Organization not found</strong></td><td>Wrong <strong>Organization Key</strong> (display name vs key)</td><td>Use the <strong>org key</strong> from the org URL or settings page. <a href="https://docs.sonarsource.com/sonarqube-cloud/getting-started/viewing-organizations?utm_source=chatgpt.com">docs.sonarsource.com</a></td></tr><tr><td><strong>No projects discovered</strong></td><td>Token user lacks access / projects private via ALM binding</td><td>Ensure the token’s user actually has access to the organization and projects in SonarQube Cloud. Re-check ALM bindings/visibility in SonarQube Cloud.</td></tr><tr><td><strong>Connection timeout</strong></td><td>Corporate firewall/proxy blocks egress</td><td>Allow outbound access from Oobeya to <code>https://sonarcloud.io</code> and required endpoints.</td></tr><tr><td><strong>SSL / TLS error</strong></td><td>Middlebox/proxy inspection or cert issue</td><td>Ensure standard TLS outbound is allowed; avoid interception that breaks TLS handshakes.</td></tr></tbody></table>

**Need help?** Contact **Oobeya Support** or your **Customer Success Manager**.

***

#### Summary: Connect in 4 Steps

<table><thead><tr><th width="88.56866455078125">Step</th><th>Action</th><th>Result</th></tr></thead><tbody><tr><td>1</td><td>Generate a <strong>SonarQube Cloud</strong> token</td><td>Secure API access</td></tr><tr><td>2</td><td>Get your <strong>Organization Key</strong></td><td>Correct org scoping</td></tr><tr><td>3</td><td><strong>Install</strong> the <strong>SonarQube Cloud</strong> add-on</td><td>Enable integration</td></tr><tr><td>4</td><td><strong>Add Data Source</strong> &#x26; test</td><td>Start syncing insights</td></tr></tbody></table>

## **Next Steps** :dart:&#x20;

* [Network Access Requirements ](/integrations/network-access-requirements)
* [Create a new Gitwiser Analysis](/gitwiser-repo-analytics/settings-for-git-analytics/initialize-development-analytics)


# Veracode Integration

Learn about Veracode & Oobeya integration.

{% hint style="info" %}
[Veracode](https://www.veracode.com/) is an application security platform that enables organizations to assess and manage the security of their software applications at scale. With Veracode, businesses can identify and remediate security flaws in their code and applications, ensuring their software is secure and compliant with industry standards.

[Oobeya](https://oobeya.io) and Veracode provide organizations with visibility into the security of their applications and code repositories. With detailed reports, development teams can track their progress over time and gain insights into potential vulnerabilities and areas for improvement.
{% endhint %}

## 1. **Generate Veracode API Credential**

1\. Navigate to **API Credentials** and generate a new API Credential in Veracode to connect [Oobeya](https://oobeya.io/).

<figure><img src="https://3582076375-files.gitbook.io/~/files/v0/b/gitbook-x-prod.appspot.com/o/spaces%2F-MGIlBSTjQtZxUoFwUx4%2Fuploads%2FWV87NB3Qnnx5p93isc4J%2Fimage.png?alt=media&amp;token=490ab21a-bc32-4d91-b9a5-89d56e4c377d" alt=""><figcaption><p>Veracode API Credentials</p></figcaption></figure>

## **2. Activate Veracode Integration on Oobeya** :jigsaw:&#x20;

1. Log in to Oobeya with an *Administrator* account.
2. Navigate to **Integrations** and select the **Veracode** addon. Then, click the **"Install"** button.

<figure><img src="https://3582076375-files.gitbook.io/~/files/v0/b/gitbook-x-prod.appspot.com/o/spaces%2F-MGIlBSTjQtZxUoFwUx4%2Fuploads%2Fk7n6Gniz5EDuxwcQAwvA%2Fimage.png?alt=media&amp;token=8d4b1543-0bb9-4146-8a3d-86457d1f647a" alt=""><figcaption><p>Veracode Oobeya Integration</p></figcaption></figure>

<figure><img src="https://3582076375-files.gitbook.io/~/files/v0/b/gitbook-x-prod.appspot.com/o/spaces%2F-MGIlBSTjQtZxUoFwUx4%2Fuploads%2FNojQzOjDCVAigGgr5J3R%2Fimage.png?alt=media&amp;token=8d0e6e8f-cfca-41a4-b530-1609e94d22c1" alt=""><figcaption></figcaption></figure>

## **3. Add A New Data Source** :electric\_plug:&#x20;

1\. Navigate to **Data Sources**, and select **Veracode** to add a new data source.&#x20;

2\. Click the **"New Data Source"** button and fill in the form using the Credentials generated on Veracode in the first step. \
\
**Server URL:** <https://api.veracode.com>

<figure><img src="https://3582076375-files.gitbook.io/~/files/v0/b/gitbook-x-prod.appspot.com/o/spaces%2F-MGIlBSTjQtZxUoFwUx4%2Fuploads%2FDr052lDHfLYorp5PltKK%2Fimage.png?alt=media&amp;token=cc3f5221-9078-4831-a6c7-bc22e5a9a06b" alt=""><figcaption><p>Veracode Data Source</p></figcaption></figure>

3\. Select **"Set as default"** to set it as a default data source. Click the **"Test Connection"** button to verify the connection.

## **Ready to Connect** :rocket:&#x20;

Oobeya is now connected with your Veracode account to provide real-time security analysis for your code. Gain deeper insights into your application security and vulnerabilities.

## **Next Steps** :dart:&#x20;

* [Network Access Requirements ](/integrations/network-access-requirements)
* [Create a new Gitwiser Analysis](/gitwiser-repo-analytics/settings-for-git-analytics/initialize-development-analytics)


# Xray Integration

Connect Jira Xray test management tool to the Oobeya Test Analytics module.

### Overview

Xray integration allows Oobeya to:

* Analyze **manual test results** from Xray projects.
* Track **UAT success and escaped defects** across projects.
* Measure **team-level testing efficiency** and defect resolution performance.
* Display metrics and trends in **Team Health > Scorecards** and organization dashboards.

***

### Prerequisites

Before starting the integration:

* You must have an active Jira instance with the **Xray plugin** installed.
* Your user account must have permission to access Xray APIs.
* An **API Token** or **Basic Auth** credentials are required.

***

### Authentication Methods

Oobeya supports both authentication types depending on your Jira environment:

<table><thead><tr><th width="236.4971923828125">Environment</th><th width="336.054443359375">Authentication Type</th></tr></thead><tbody><tr><td><strong>Xray Cloud</strong></td><td>API Token or Basic Auth</td></tr><tr><td><strong>Xray Server / DC</strong></td><td>API Token or Basic Auth</td></tr></tbody></table>

{% hint style="info" %}
&#x20;For Xray Cloud users, you can generate your API token from Atlassian Account → Security → API Tokens.
{% endhint %}

***

### Setting up the Integration

#### Step 1 — Enable Xray Plugin

Go to `Integrations → Test → Xray` and make sure the Xray addon is **installed**.

#### Step 2 — Add Data Source

1. Navigate to `Data Sources`.
2. Click **Xray** addon and click **New Data Source**.
3. Fill in the connection details:

<table><thead><tr><th width="158.52154541015625">Field</th><th width="293.4365234375">Description</th><th width="315.4296875">Example</th></tr></thead><tbody><tr><td><strong>Data Source Name</strong></td><td>A custom name for your connection.</td><td>Company Xray Server</td></tr><tr><td><strong>Server URL</strong></td><td>Base URL of your Jira Xray instance.</td><td><p>Server: <code>https://JIRA_SERVER_URL</code> </p><p>Cloud: <code>https://yourcompany.atlassian.net</code></p></td></tr><tr><td><strong>Access Type</strong></td><td>Choose <strong>Basic</strong> or <strong>Token</strong>.</td><td>-</td></tr><tr><td><strong>Username / Email</strong></td><td>Your Jira username or email address.</td><td>test@company.com</td></tr><tr><td><strong>Password / Token</strong></td><td>Jira password or API token.</td><td>●●●●●●●</td></tr></tbody></table>

4. Click **Test Connection** to validate credentials.
5. Once the connection succeeds, click **Add** to save.

<figure><img src="https://docs.oobeya.io/assets/xray-datasource-setup.png" alt=""><figcaption><p>Xray Data Source Configuration</p></figcaption></figure>

***

### How It Works

Once connected, Oobeya can retrieve and process data from Xray:

* **Test Executions** – total test runs, status (pass/fail), duration, and owner.
* **Test Cases** – manual test details and associated UAT mappings.
* **Defects** – linked or related bugs for each test execution.

This data is normalized and displayed within the **Test Analytics** module.

***

### Troubleshooting

| Issue                  | Possible Cause               | Resolution                                  |
| ---------------------- | ---------------------------- | ------------------------------------------- |
| Connection test fails  | Wrong URL or expired token   | Recheck credentials and API token validity. |
| No test data retrieved | Insufficient API permissions | Ensure your Jira user has Xray API access.  |

## **Next Steps** :dart:&#x20;

* [Network Access Requirements ](/integrations/network-access-requirements)
* [Create a new Gitwiser Analysis](/gitwiser-repo-analytics/settings-for-git-analytics/initialize-development-analytics)


# Project Management

Learn about how you can integrate your Project Management tools with Oobeya.

{% content-ref url="/pages/-MVKvqZkUpau4GLi1GTJ" %}
[Jira Server Integration](/integrations/all-integrations/project-management-addons/jira-server-integration)
{% endcontent-ref %}

{% content-ref url="/pages/-MVKrLlCLSQ\_orOd5CQJ" %}
[Jira Cloud Integration](/integrations/all-integrations/project-management-addons/jira-cloud-integration)
{% endcontent-ref %}

{% content-ref url="/pages/-MGNJpbG4u4kLeyawJ7P" %}
[Azure DevOps Integration](/integrations/all-integrations/scm-addons/azure-devops-integration)
{% endcontent-ref %}


# Jira Cloud Integration

Learn about Jira Cloud & Oobeya integration.

## 1. **Generate Jira Cloud API Token**

1. Click on the **profile** picture at the top right of the screen, then select **Account Settings**.&#x20;

![](https://firebasestorage.googleapis.com/v0/b/gitbook-x-prod.appspot.com/o/spaces%2F-MGIlBSTjQtZxUoFwUx4%2Fuploads%2FbJT79Dk5G6ERsBMk17Ej%2Ffile.png?alt=media)

2\. Open the "Security" tab.

![Select Security tab.](https://firebasestorage.googleapis.com/v0/b/gitbook-x-prod.appspot.com/o/spaces%2F-MGIlBSTjQtZxUoFwUx4%2Fuploads%2FdnJTMy2uk35njnI22hpk%2Ffile.png?alt=media)

3\. Click the link "**Create and manage API tokens**" under the API Token section.

![](https://firebasestorage.googleapis.com/v0/b/gitbook-x-prod.appspot.com/o/spaces%2F-MGIlBSTjQtZxUoFwUx4%2Fuploads%2F0mpsKeUqc89JaOJOoVZv%2Ffile.png?alt=media)

4\. Click the "**Create API token**" button at the top of the page.&#x20;

<figure><img src="https://3582076375-files.gitbook.io/~/files/v0/b/gitbook-x-prod.appspot.com/o/spaces%2F-MGIlBSTjQtZxUoFwUx4%2Fuploads%2FknosWWLqYDAZWUeyJEce%2Fimage.png?alt=media&amp;token=6a34b4f5-aeb2-47c9-99ae-c751cea3438f" alt=""><figcaption></figcaption></figure>

5. Make sure you copy your new API token for further use.

<figure><img src="https://3582076375-files.gitbook.io/~/files/v0/b/gitbook-x-prod.appspot.com/o/spaces%2F-MGIlBSTjQtZxUoFwUx4%2Fuploads%2FnWGTWW2c9BAliG4HqEwx%2Fimage.png?alt=media&amp;token=148bc2d8-ecab-46b5-99cc-7fd8e148b4b9" alt=""><figcaption></figcaption></figure>

## **2. Install Jira Addon on Oobeya** :jigsaw:&#x20;

1. Log in to [Oobeya](https://oobeya.io/) with an *Administrator* account.
2. Navigate to **Integrations** and select the **Jira** addon and then click the **"Install"** button.

![](https://3582076375-files.gitbook.io/~/files/v0/b/gitbook-x-prod.appspot.com/o/spaces%2F-MGIlBSTjQtZxUoFwUx4%2Fuploads%2FwkLN7Xu9VT4h78rQSlBt%2FScreenshot%202024-12-17%20at%2013.37.58.png?alt=media\&token=ac82c855-2d14-4bc8-a4e1-30c9d9762f08)

## **3. Add A New Data Source** :electric\_plug:&#x20;

1\. Navigate to **Data Sources**, select Jira to add a new data source.&#x20;

![](https://firebasestorage.googleapis.com/v0/b/gitbook-x-prod.appspot.com/o/spaces%2F-MGIlBSTjQtZxUoFwUx4%2Fuploads%2F2RNvEaQB5JJsMdfJKp6G%2Ffile.png?alt=media)

2\. Click the **"New Data Source"** button and fill in the form.

* **Server URL:** Enter your Jira Cloud account URL (e.g. <https://yourcompany.atlassian.net>)
* **Username:** Enter the email address registered on Jira Cloud.
* **Password:** Enter the API Token which was created on Jira settings in the first step.

![](https://firebasestorage.googleapis.com/v0/b/gitbook-x-prod.appspot.com/o/spaces%2F-MGIlBSTjQtZxUoFwUx4%2Fuploads%2FGJWsJ31zrtTHKbIyxRDG%2Ffile.png?alt=media)

3. Click the **"Test Connection"** button to verify the connection.

&#x20;4\. Select the **"Set as default"** option to provide a default data source for the Scorecards.

## **Ready to Connect** :rocket:&#x20;

Now Oobeya is connected with your own Jira Cloud account to get the real-time project management data of your organization.

## **Next Steps** :dart:&#x20;

* [Network Access Requirements ](/integrations/network-access-requirements)
* [Create a new Gitwiser Analysis](/gitwiser-repo-analytics/settings-for-git-analytics/initialize-development-analytics)


# Jira Server Integration

Learn about Jira Server & Oobeya integration.

## &#x31;**. Install Jira Addon on Oobeya** :jigsaw:&#x20;

1. Log in to Oobeya with an *Administrator* account.
2. Navigate to **Integrations** and select the **Jira** addon and then click the **"Install"** button.

![](https://3582076375-files.gitbook.io/~/files/v0/b/gitbook-x-prod.appspot.com/o/spaces%2F-MGIlBSTjQtZxUoFwUx4%2Fuploads%2FwkLN7Xu9VT4h78rQSlBt%2FScreenshot%202024-12-17%20at%2013.37.58.png?alt=media\&token=ac82c855-2d14-4bc8-a4e1-30c9d9762f08)

## **2. Add A New Data Source** :electric\_plug:&#x20;

1\. Navigate to **Data Sources**, select Jira to add a new data source.&#x20;

![](https://firebasestorage.googleapis.com/v0/b/gitbook-x-prod.appspot.com/o/spaces%2F-MGIlBSTjQtZxUoFwUx4%2Fuploads%2F0ZxAvRHRZsRHpSnAEp2N%2Ffile.png?alt=media)

2\. Click the **"New Data Source"** button and fill in the form.

![](https://firebasestorage.googleapis.com/v0/b/gitbook-x-prod.appspot.com/o/spaces%2F-MGIlBSTjQtZxUoFwUx4%2Fuploads%2FmEGTnq0Vt6b3FyiV1x7r%2Ffile.png?alt=media)

3.Click the **"Test Connection"** button to verify the connection.

4\. Select the **"Set as default"** option to provide a default data source to the Scorecards.

## **Ready to Connect** :rocket:&#x20;

Now Oobeya is connected with your own Jira Server account to get the real-time project management data of your organization.

## **Next Steps** :dart:&#x20;

* [Network Access Requirements ](/integrations/network-access-requirements)
* [Create a new Gitwiser Analysis](/gitwiser-repo-analytics/settings-for-git-analytics/initialize-development-analytics)


# APM / Monitoring

Learn about how you can integrate your APM / Monitoring tools with Oobeya.

<table><thead><tr><th width="246">Tool</th><th width="182">Categories</th><th width="205">Modules</th><th>Plan</th></tr></thead><tbody><tr><td><a href="/integrations/all-integrations/apm-monitoring-addons/appdynamics-integration">AppDynamics</a></td><td>Monitoring &#x26; APM</td><td></td><td></td></tr><tr><td><a href="/integrations/all-integrations/apm-monitoring-addons/azure-application-insights-integration">Azure Application Insights</a></td><td>Monitoring &#x26; APM</td><td>APM</td><td>Cloud</td></tr><tr><td><a href="/integrations/all-integrations/apm-monitoring-addons/dynatrace-integration">Dynatrace</a></td><td></td><td></td><td></td></tr><tr><td><a href="/integrations/all-integrations/apm-monitoring-addons/elastic-apm-integration">Elastic APM</a></td><td></td><td></td><td></td></tr><tr><td><a href="/integrations/all-integrations/apm-monitoring-addons/new-relic-integration">New Relic</a></td><td>Monitoring &#x26; APM</td><td>APM, Incident Management</td><td>Cloud</td></tr><tr><td>Datadog (beta)</td><td>Monitoring &#x26; APM</td><td>APM, Incident Management</td><td>Cloud</td></tr><tr><td><a href="/integrations/all-integrations/apm-monitoring-addons/sentry-integration">Sentry</a></td><td></td><td></td><td></td></tr></tbody></table>


# AppDynamics Integration

Learn about AppDynamics & Oobeya integration.

## 1. Create A Local User for Oobeya

1. Access Appdynamics Controller and click the top right button on the screen.

![](https://3582076375-files.gitbook.io/~/files/v0/b/gitbook-x-prod.appspot.com/o/spaces%2F-MGIlBSTjQtZxUoFwUx4%2Fuploads%2F7lYAwBX8oHoZOLZbtukx%2Fimage.png?alt=media\&token=29893d41-ce8a-43d6-a427-33c23519e87e)

2\. Select the “**Administration**”

![](https://3582076375-files.gitbook.io/~/files/v0/b/gitbook-x-prod.appspot.com/o/spaces%2F-MGIlBSTjQtZxUoFwUx4%2Fuploads%2FSt3G8OXHtshKHd9wssfH%2Fimage.png?alt=media\&token=ec309d92-38b0-4557-975e-106ce1bacd75)

3\. In the "**Users**" tab, click “**Create**” and **fill** in the required fields.

4\. Add Roles by clicking the "**Add**” button below the Roles section.

![](https://3582076375-files.gitbook.io/~/files/v0/b/gitbook-x-prod.appspot.com/o/spaces%2F-MGIlBSTjQtZxUoFwUx4%2Fuploads%2F2w7FDhfFClkeG6eHRhTM%2Fimage.png?alt=media\&token=4f553974-f918-422a-94ad-1ac44bbb61a5)

5\. Select the listed role, then create the account by clicking “**Save**”.

<figure><img src="https://3582076375-files.gitbook.io/~/files/v0/b/gitbook-x-prod.appspot.com/o/spaces%2F-MGIlBSTjQtZxUoFwUx4%2Fuploads%2Fbp6awAQqxwxlppUssX3P%2Fimage.png?alt=media&amp;token=56c77210-1cfc-4d42-a733-c5955558f2c7" alt="" width="375"><figcaption></figcaption></figure>

## 2. Install AppDynamics Addon on Oobeya

1. Log in to Oobeya with an Administrator account.
2. Navigate to **Integrations** and select the **Appdynamics** addon and then click the "Install" button.

![](https://3582076375-files.gitbook.io/~/files/v0/b/gitbook-x-prod.appspot.com/o/spaces%2F-MGIlBSTjQtZxUoFwUx4%2Fuploads%2FV1huV4em7epFcfbckLdE%2Fimage.png?alt=media\&token=7b3ea9c0-8420-4426-ada1-2ac93fb9431e)

## 3. Add A New Data Source

1. Navigate to **Data Sources**, and select **Appdynamics** to add a new data source.
2. Click the "**New Data Source**" button and fill in the form by using the **Account that** was created on Appdynamics in the first step. You can type any name you want for the "Data Source Name" field.

<img src="https://3582076375-files.gitbook.io/~/files/v0/b/gitbook-x-prod.appspot.com/o/spaces%2F-MGIlBSTjQtZxUoFwUx4%2Fuploads%2FyvDt0uy7g1BlcE3fi7RJ%2Fimage.png?alt=media&amp;token=b860cff4-c5af-4d98-b638-95216b1c0c8b" alt="" width="375">

## Ready to Connect :rocket:&#x20;

Oobeya is now connected with your AppDynamics account to give you real-time performance monitoring and analytics for your applications. Stay ahead with insights into application health and performance.

## **Next Steps** :dart:&#x20;

* [Network Access Requirements ](/integrations/network-access-requirements)
* [Create a new Gitwiser Analysis](/gitwiser-repo-analytics/settings-for-git-analytics/initialize-development-analytics)


# Azure Application Insights Integration

Learn about Azure Application Insights & Oobeya integration.

***

## 1. Generate Auth Token

1. **Select your application in Azure Application Insights**:
   * Go to your Azure Application Insights account and select the desired application.
2. **Navigate to API key configuration**:
   * Under the "**Configure**" section, click on the **API Access**.
   * Save the **Application ID** for later use in the integration with Oobeya.\ <br>

     <figure><img src="https://3582076375-files.gitbook.io/~/files/v0/b/gitbook-x-prod.appspot.com/o/spaces%2F-MGIlBSTjQtZxUoFwUx4%2Fuploads%2F3lwbaz10dP7VwHtpKqm6%2Fimage.png?alt=media&amp;token=d435b536-169e-4ff8-8202-84a90252e6da" alt=""><figcaption><p>Create API key - Application Insights</p></figcaption></figure>
3. **Create a new API key**:
   * In the top-left corner, click on **Create API Key**.
4. **Set token permissions**:
   * Assign the required permissions for Oobeya:
     * **Read Telemetry**
     * **Authenticate SDK Control Channel**
   * Once the key is created, make sure to copy it for use in the next steps.

***

## 2. Install Azure Application Insights Addon on Oobeya

1. **Log in to Oobeya** with an Administrator account.
2. Go to the **Integrations** page, find the **Azure Application Insights** addon, and click the **Install** button.

<figure><img src="https://3582076375-files.gitbook.io/~/files/v0/b/gitbook-x-prod.appspot.com/o/spaces%2F-MGIlBSTjQtZxUoFwUx4%2Fuploads%2FFr2pTnP5J1AcqtfT3jRN%2Fimage.png?alt=media&amp;token=0d9c6716-b205-4329-b3b1-9a10120c2295" alt=""><figcaption><p>Oobeya Integrations</p></figcaption></figure>

***

## 3. Add a New Data Source

1. Go to the **Data Sources** section in Oobeya and select **Azure Application Insights**.
2. **Create a new data source**:
   * Click on the **New Data Source** button.
   * Choose a custom name for your data source in the **Data Source Name** field.
   * Enter the **API Key** you created earlier in Azure Application Insights.
   * Input the **Application ID** you saved.

<div data-full-width="false"><figure><img src="https://3582076375-files.gitbook.io/~/files/v0/b/gitbook-x-prod.appspot.com/o/spaces%2F-MGIlBSTjQtZxUoFwUx4%2Fuploads%2FUNr7Z6ktO6udv5MNMtVy%2Fimage.png?alt=media&amp;token=8adf0cc7-b6e2-444c-982a-6c62a4bdbad5" alt=""><figcaption><p>Data source connection</p></figcaption></figure></div>

***

## Ready to Connect :rocket:&#x20;

Your Oobeya instance is now successfully connected to your Azure Application Insights account. You can now begin to diagnose, fix, and optimize the performance of your code using Oobeya's insights and analytics tools.

## **Next Steps** :dart:&#x20;

* [Network Access Requirements ](/integrations/network-access-requirements)
* [Create a new Gitwiser Analysis](/gitwiser-repo-analytics/settings-for-git-analytics/initialize-development-analytics)


# Dynatrace Integration

## 1. Generate a Dynatrace Access Token :tools:&#x20;

1. Click on the search box and search for “Access Tokens”.<br>

   <figure><img src="https://3582076375-files.gitbook.io/~/files/v0/b/gitbook-x-prod.appspot.com/o/spaces%2F-MGIlBSTjQtZxUoFwUx4%2Fuploads%2FigfFB8DzrLTsxYCElNFO%2Fimage.png?alt=media&amp;token=bc4aeda2-03f3-43d9-b1b3-a13bf3e1aeba" alt=""><figcaption><p>Dynatrace Access Tokens</p></figcaption></figure>
2. Click on the "**Generate new token**" button: <br>

   <figure><img src="https://3582076375-files.gitbook.io/~/files/v0/b/gitbook-x-prod.appspot.com/o/spaces%2F-MGIlBSTjQtZxUoFwUx4%2Fuploads%2FuZXuhXRpl9UQGJdlL1SO%2Fimage.png?alt=media&amp;token=fea4ab92-48f7-4e74-8123-9dbd51494c1f" alt=""><figcaption></figcaption></figure>
3. Select the required permission scopes. \
   **Required Scopes:** Read API token, Read entities, Read metrics\
   \
   The required **URL address** (https\://\*\*\*\*\*\*\*.live.dynatrace.com) for Oobeya's data source form is in the second box below. You can copy it.\
   \
   Then, click on the "Generate token" button.<br>

   <figure><img src="https://3582076375-files.gitbook.io/~/files/v0/b/gitbook-x-prod.appspot.com/o/spaces%2F-MGIlBSTjQtZxUoFwUx4%2Fuploads%2FWzY06hqyvZRZNi59F3CB%2Fimage.png?alt=media&amp;token=d635c751-da57-4f04-a653-529ef36e908b" alt=""><figcaption></figcaption></figure>

## 2. Install Dynatrace on Oobeya :jigsaw:&#x20;

1. Log in to [Oobeya](https://oobeya.io/) with an Administrator account.&#x20;
2. Navigate to **Integrations**, select Dynatrace, and click the "**Install**" button. <br>

   <figure><img src="https://3582076375-files.gitbook.io/~/files/v0/b/gitbook-x-prod.appspot.com/o/spaces%2F-MGIlBSTjQtZxUoFwUx4%2Fuploads%2F9DOrq74XAsf7ruUVFLNz%2Fimage.png?alt=media&amp;token=4f1ef5e0-a325-4b9c-a41d-59b538efc27f" alt=""><figcaption><p>Oobeya Dynatrace Integration</p></figcaption></figure>

## 3. Add A New Data Source :electric\_plug:&#x20;

1. Navigate to **Data Sources**, and select **Dynatrace** to add a new data source.&#x20;
2. Click the "**New Data Source**" button and fill in the form using the Token generated on Dynatrace in the first step. You can type any name for the "Data Source Name" field. <br>
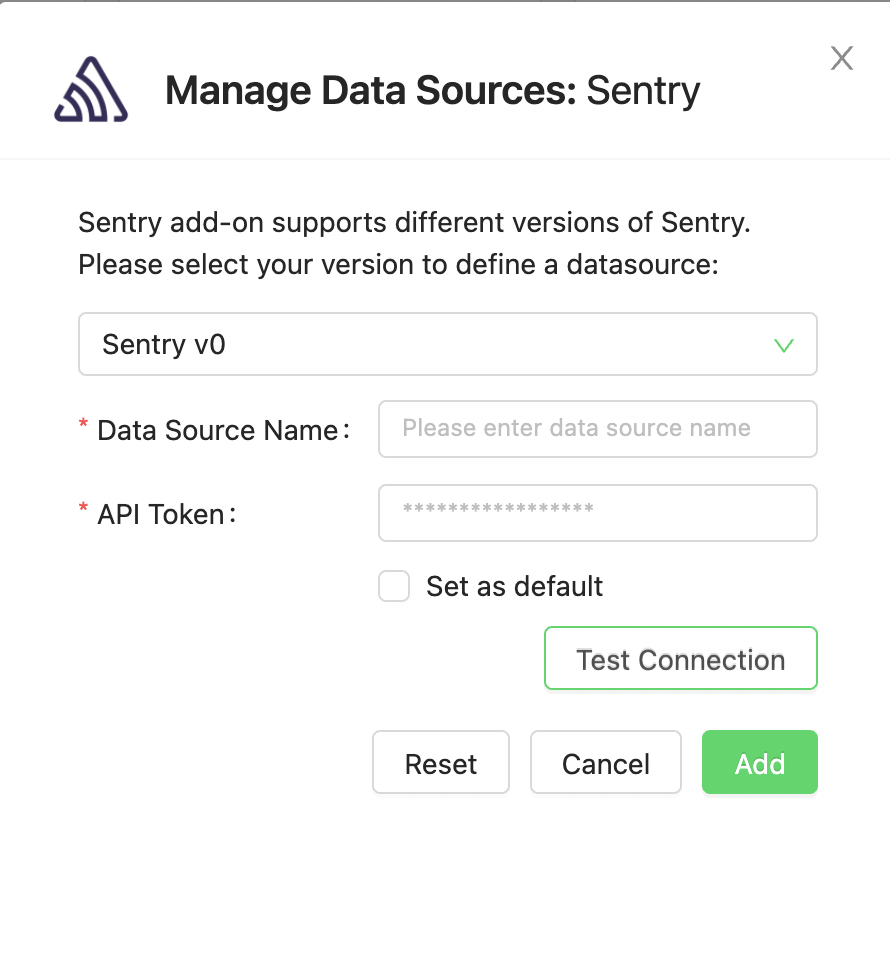
   <figure><img src="https://3582076375-files.gitbook.io/~/files/v0/b/gitbook-x-prod.appspot.com/o/spaces%2F-MGIlBSTjQtZxUoFwUx4%2Fuploads%2FxG8o8JFCVU8z8ztBtdKi%2Fimage.png?alt=media&amp;token=f39624e8-0afe-425e-8198-ad02ffefb830" alt=""><figcaption><p>Dynatrace Data Source Connection Form</p></figcaption></figure>
3. &#x20;Click the "**Test Connection**" button to verify the connection.&#x20;

## Ready to Connect :rocket:&#x20;

Now Oobeya is connected to your **Dynatrace** account to diagnose, fix, and optimize the performance of the code.&#x20;

## **Next Steps** :dart:&#x20;

* [Network Access Requirements ](/integrations/network-access-requirements)
* [Create a new Gitwiser Analysis](/gitwiser-repo-analytics/settings-for-git-analytics/initialize-development-analytics)


# Elastic APM Integration

Learn about Elastic APM & Oobeya Integration.

This guide will walk you through the steps required to integrate Elastic APM with Oobeya.

***

## 1. Getting the Integration URL

**If You Are Connecting via HTTPS:**

* If you’re connecting via HTTPS, retrieve the base URL for Kibana directly from your browser. This URL is the address shown in the browser's address bar.

<figure><img src="https://3582076375-files.gitbook.io/~/files/v0/b/gitbook-x-prod.appspot.com/o/spaces%2F-MGIlBSTjQtZxUoFwUx4%2Fuploads%2FAY3Sm0wURFdAQXGru8oI%2Fimage.png?alt=media&amp;token=dc6197bc-b3d3-4bd2-9e54-f2181182ea45" alt=""><figcaption></figcaption></figure>

**If You Are Connecting via HTTP:**

* If you’re not using HTTPS, the URL structure would be:\
  `http://<Your_IP_or_Domain>:5601`\
  where `<Your_IP_or_Domain>` refers to the IP address or the Domain of the server running Kibana.

***

## 2. Getting the Integration Username and Password

* Use the same username and password that were entered on the screen to log into Oobeya.

<figure><img src="https://3582076375-files.gitbook.io/~/files/v0/b/gitbook-x-prod.appspot.com/o/spaces%2F-MGIlBSTjQtZxUoFwUx4%2Fuploads%2F6RZi4KT3jaR41Nay6aTT%2Fimage.png?alt=media&amp;token=9050cb5e-0f1b-432f-aa19-ca56c7650c97" alt=""><figcaption></figcaption></figure>

***

## 3. Install Elastic APM on Oobeya

1. **Log in to Oobeya** with an Administrator account.
2. Go to the **Integrations** section, select **Elastic APM**, and click the **Install** button.

<figure><img src="https://3582076375-files.gitbook.io/~/files/v0/b/gitbook-x-prod.appspot.com/o/spaces%2F-MGIlBSTjQtZxUoFwUx4%2Fuploads%2FugdAJZ1KCGZCjB9Y2FJl%2Fimage.png?alt=media&amp;token=772aafec-f79e-4419-b591-9b7d12f1204a" alt=""><figcaption><p>Oobeya Integrations</p></figcaption></figure>

***

## 4. Create Data Source and Test Connection

1. Go to the **Data Sources** section in Oobeya, and select **Elastic APM**.
2. **Create a new data source**:
   * Click on the **New Data Source** button.
   * Fill out the form using the URL, username, and password obtained in Step 1.
   * You can assign any name for the **Data Source Name** field.
3. **Test the connection**:
   * Click the **Test Connection** button to verify the connection with Elastic APM.

<figure><img src="https://3582076375-files.gitbook.io/~/files/v0/b/gitbook-x-prod.appspot.com/o/spaces%2F-MGIlBSTjQtZxUoFwUx4%2Fuploads%2FehDRl38OpHclkWv8unne%2Fimage.png?alt=media&amp;token=40a9c630-5da2-4bcd-9869-bf0d5c1e30f7" alt=""><figcaption><p>Data source connection</p></figcaption></figure>

***

## Ready to Connect :rocket:&#x20;

Your Oobeya instance is now connected to your Elastic APM account. You can begin diagnosing, fixing, and optimizing the performance of your code with Oobeya's analysis tools.

## **Next Steps** :dart:&#x20;

* [Network Access Requirements ](/integrations/network-access-requirements)
* [Create a new Gitwiser Analysis](/gitwiser-repo-analytics/settings-for-git-analytics/initialize-development-analytics)


# New Relic Integration

Learn about New Relic & Oobeya Integration.

## 1. **Create An API Key on New Relic** :tools:&#x20;

1. Click the **"Profile"** button as in the figure.

![](https://3582076375-files.gitbook.io/~/files/v0/b/gitbook-x-prod.appspot.com/o/spaces%2F-MGIlBSTjQtZxUoFwUx4%2Fuploads%2FdUP3V0ghiIrJTbNR4lwH%2FPicture1.png?alt=media\&token=30db3217-4b8d-4652-8268-53ba5a02e6b8)

2\. Click the **"API Keys"** button.

![](https://3582076375-files.gitbook.io/~/files/v0/b/gitbook-x-prod.appspot.com/o/spaces%2F-MGIlBSTjQtZxUoFwUx4%2Fuploads%2FWkGVNsLmtis5Xo4PPTrJ%2FPicture2.png?alt=media\&token=bd3a5e55-a0aa-497c-8059-8cc306074cc5)

3. Click the "Create a key" button.

<figure><img src="https://3582076375-files.gitbook.io/~/files/v0/b/gitbook-x-prod.appspot.com/o/spaces%2F-MGIlBSTjQtZxUoFwUx4%2Fuploads%2FLNhZLuGBiwl4Q4oPViUS%2Fimage.png?alt=media&amp;token=0900538d-ef9b-495c-8509-47ae9bcacf25" alt=""><figcaption></figcaption></figure>

4. Select the account and click the "Create a key" button to create the API key.

<figure><img src="https://3582076375-files.gitbook.io/~/files/v0/b/gitbook-x-prod.appspot.com/o/spaces%2F-MGIlBSTjQtZxUoFwUx4%2Fuploads%2FBeguRC0IZmSGzjUKAeB3%2Fimage.png?alt=media&amp;token=781b4d3a-8fd7-4414-bc36-1400337b3a8a" alt="" width="375"><figcaption></figcaption></figure>

## 2. Creating A Query Key on New Relic Insights

1. Click the **"Profile"** button as in the figure.&#x20;

<figure><img src="https://3582076375-files.gitbook.io/~/files/v0/b/gitbook-x-prod.appspot.com/o/spaces%2F-MGIlBSTjQtZxUoFwUx4%2Fuploads%2FzkJlbh4nQ7FpKwUgD0S4%2FPicture5.png?alt=media&amp;token=cfadaa9a-1a64-4ab7-8640-3681aba8a5dc" alt=""><figcaption></figcaption></figure>

2\. Click the "**API Keys**" button.&#x20;

<figure><img src="https://3582076375-files.gitbook.io/~/files/v0/b/gitbook-x-prod.appspot.com/o/spaces%2F-MGIlBSTjQtZxUoFwUx4%2Fuploads%2FiPQgFGkwL5eW9IsTkv26%2FPicture6.png?alt=media&amp;token=fec91475-976e-4af8-9b10-c5a6ffaf5dd7" alt=""><figcaption></figcaption></figure>

3\. Click on the **"Insights Query Keys”** button.

<figure><img src="https://3582076375-files.gitbook.io/~/files/v0/b/gitbook-x-prod.appspot.com/o/spaces%2F-MGIlBSTjQtZxUoFwUx4%2Fuploads%2FkUNIjDCakexwELVH18yo%2FInsight%20Query%20Keys%20pic.png?alt=media&amp;token=fbeea54c-620a-4a7b-9919-686daea05064" alt=""><figcaption></figcaption></figure>

4. Click the add icon next to the **"Query Keys"** to add a query key.

<figure><img src="https://3582076375-files.gitbook.io/~/files/v0/b/gitbook-x-prod.appspot.com/o/spaces%2F-MGIlBSTjQtZxUoFwUx4%2Fuploads%2FLqgM7vB2c6dadK5ScIwq%2Fimage.png?alt=media&amp;token=e829b837-188c-41aa-a999-a809e74d7d2a" alt=""><figcaption></figcaption></figure>

5. You can use the created query key as shown below to add a data source in Oobeya.

## 4. Install New Relic Addon on Oobeya :jigsaw:&#x20;

1. Log in to [Oobeya](https://oobeya.io/) with an Administrator account.&#x20;
2. Navigate to **Market Place**, select the New Relic addon, and click the "Install" button.&#x20;

![](https://firebasestorage.googleapis.com/v0/b/gitbook-x-prod.appspot.com/o/spaces%2F-MGIlBSTjQtZxUoFwUx4%2Fuploads%2FtXRaoicPRPiE355kyVDA%2Ffile.png?alt=media)

## 3. Add A New Data Source :electric\_plug:&#x20;

1. Navigate to **Data Sources**, and select New Relic to add a new data source.&#x20;

<img src="https://firebasestorage.googleapis.com/v0/b/gitbook-x-prod.appspot.com/o/spaces%2F-MGIlBSTjQtZxUoFwUx4%2Fuploads%2FQVr9tGImhOxrkux59Wv3%2Ffile.png?alt=media" alt="" width="375">

2\. Click the "**New Data Source**" button and fill in the form. *API Token* from Step-1 and *Query Key* from Step-2.&#x20;

<img src="https://firebasestorage.googleapis.com/v0/b/gitbook-x-prod.appspot.com/o/spaces%2F-MGIlBSTjQtZxUoFwUx4%2Fuploads%2FgzLsech8ElxSEIciA7Tf%2Ffile.png?alt=media" alt="" width="375">

3\. Click the "**Test Connection**" button to verify the connection.&#x20;

## Ready to Connect :rocket:&#x20;

Now Oobeya is connected with your own New Relic account to track the real-time and average performance metrics.&#x20;

## **Next Steps** :dart:&#x20;

* [Network Access Requirements ](/integrations/network-access-requirements)
* [Create a new Gitwiser Analysis](/gitwiser-repo-analytics/settings-for-git-analytics/initialize-development-analytics)


# Sentry Integration

Learn about Sentry & Oobeya Integration.

## 1. Generate Sentry Auth Token :tools:&#x20;

1. Click on your **account** name on Sentry and select the "**API keys**" as in the following:&#x20;

![](https://firebasestorage.googleapis.com/v0/b/gitbook-x-prod.appspot.com/o/spaces%2F-MGIlBSTjQtZxUoFwUx4%2Fuploads%2F02MyNKdx6EC4OSpB9seu%2Ffile.png?alt=media)

2\. Click to the "**Create New Token**" button:&#x20;

![](https://firebasestorage.googleapis.com/v0/b/gitbook-x-prod.appspot.com/o/spaces%2F-MGIlBSTjQtZxUoFwUx4%2Fuploads%2Fg8cOw0U6XLkbBb8Z6vl6%2Ffile.png?alt=media)

3\. Configure the "**Scopes**" area by selecting permissions and then click the "**Create Token**" button.&#x20;

![Inserting image...](https://firebasestorage.googleapis.com/v0/b/gitbook-x-prod.appspot.com/o/spaces%2F-MGIlBSTjQtZxUoFwUx4%2Fuploads%2FbiL51gPGL9GYDblzgT2q%2Ffile.png?alt=media)

4\. Copy and save the auth token.

![](https://firebasestorage.googleapis.com/v0/b/gitbook-x-prod.appspot.com/o/spaces%2F-MGIlBSTjQtZxUoFwUx4%2Fuploads%2FaEoYHdQaKLCuzuhLyA4A%2Ffile.png?alt=media)

## 2. Install Sentry Addon on Oobeya :jigsaw:&#x20;

1. Log in to [Oobeya](https://oobeya.io/) with an Administrator account.&#x20;
2. Navigate to **Market Place**, select the Sentry addon, and click the "**Install**" button.&#x20;

![Inserting image...](https://firebasestorage.googleapis.com/v0/b/gitbook-x-prod.appspot.com/o/spaces%2F-MGIlBSTjQtZxUoFwUx4%2Fuploads%2Fadykdmz0970eOEBzy2Du%2Ffile.png?alt=media)

## 3. Add A New Data Source :electric\_plug:&#x20;

1. Navigate to **Data Sources**, and select **Sentry** to add a new data source.&#x20;

![Inserting image...](https://firebasestorage.googleapis.com/v0/b/gitbook-x-prod.appspot.com/o/spaces%2F-MGIlBSTjQtZxUoFwUx4%2Fuploads%2FhOVW8k35O7kUv0uqpHgn%2Ffile.png?alt=media)

2\. Click the "**New Data Source**" button and fill in the form using the Token generated on Sentry in the first step. You can type any name for the "Data Source Name" field.&#x20;

![](https://firebasestorage.googleapis.com/v0/b/gitbook-x-prod.appspot.com/o/spaces%2F-MGIlBSTjQtZxUoFwUx4%2Fuploads%2FqVaJhi6pK6FGF7WHNABo%2Ffile.png?alt=media)

3\. Click the "**Test Connection**" button to verify the connection.&#x20;

![](https://firebasestorage.googleapis.com/v0/b/gitbook-x-prod.appspot.com/o/spaces%2F-MGIlBSTjQtZxUoFwUx4%2Fuploads%2FtiMCmmjnnJPIjgiDxfK7%2Ffile.png?alt=media)

## Ready to Connect :rocket:&#x20;

Now Oobeya is connected with your own **Sentry** account to diagnose, fix, and optimize the performance of the code.&#x20;

## **Next Steps** :dart:&#x20;

* [Network Access Requirements ](/integrations/network-access-requirements)
* [Create a new Gitwiser Analysis](/gitwiser-repo-analytics/settings-for-git-analytics/initialize-development-analytics)


# Adding New Integration

Step-by-step guide to add a new integration:

{% stepper %}
{% step %}

### [Installing An Addon](/integrations/adding-new-integration/installing-an-addon)

The integrations placed in Oobeya allow you to connect your SDLC/DevOps tools with Oobeya, enabling data collection.
{% endstep %}

{% step %}

### [Adding A New Data Source](/integrations/adding-new-integration/adding-a-new-data-source)

After installing an addon on the Oobeya Integrations page, you can add a new data source to connect your tools and accounts with Oobeya.
{% endstep %}

{% step %}

### [Updating and Deleting Data Sources](/integrations/adding-new-integration/updating-and-deleting-data-sources)

Learn how to manage your existing data sources.
{% endstep %}
{% endstepper %}


# Installing An Addon

Learn about how to work with addons on Oobeya Integrations...

## **OVERVIEW**

The addons placed in Oobeya Integrations allow you to **connect your SDLC/ALM tools with Oobeya** to enable ***real-time quality monitoring***.

[Oobeya Integrations](https://oobeya.io/integrations/) is the main page where you browse and install your addons.
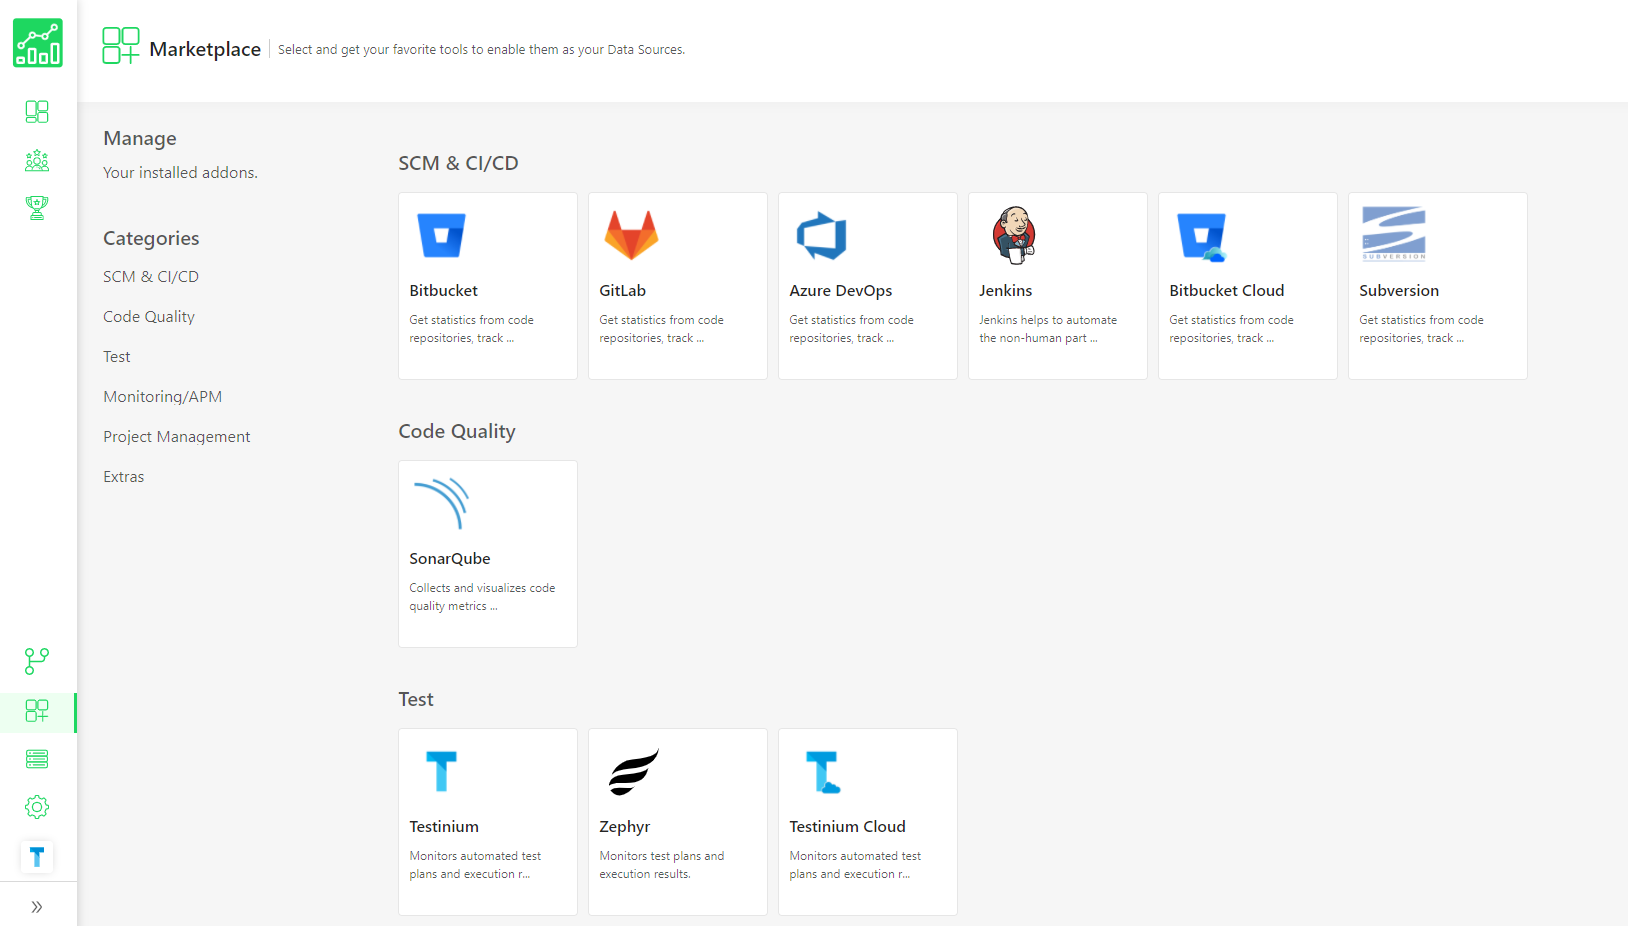
![](https://firebasestorage.googleapis.com/v0/b/gitbook-x-prod.appspot.com/o/spaces%2F-MGIlBSTjQtZxUoFwUx4%2Fuploads%2FKApFdv3XgSlFf72Hhkie%2Ffile.png?alt=media)

## **ADDON CATEGORIES**

Addons are divided into six main categories:

* SCM & CI/CD
* Code Quality & Security
* Test & QA
* Monitoring/APM
* Project Management
* Extras

## **INSTALLING AN ADDON**

1. Navigate to **Oobeya Integrations**.
2. Click the addon you want to install.
3. Click the "**Install**" button.&#x20;

![](https://firebasestorage.googleapis.com/v0/b/gitbook-x-prod.appspot.com/o/spaces%2F-MGIlBSTjQtZxUoFwUx4%2Fuploads%2FIZ4TU6AVDUeFK7BzjuNM%2Ffile.png?alt=media)

## **WHAT'S NEXT?** :dart:&#x20;

* [Adding a new data source](/integrations/adding-new-integration/adding-a-new-data-source)


# Adding A New Data Source

Learn about how to add Data Sources in order to connect your own tools...

## **OVERVIEW**

If you want to work with a data source, you must install the addon of the tool that you want to connect.

After installing an addon on Oobeya Integrations page, you are able to add a new data source in order to connect your own tools and accounts with Oobeya.
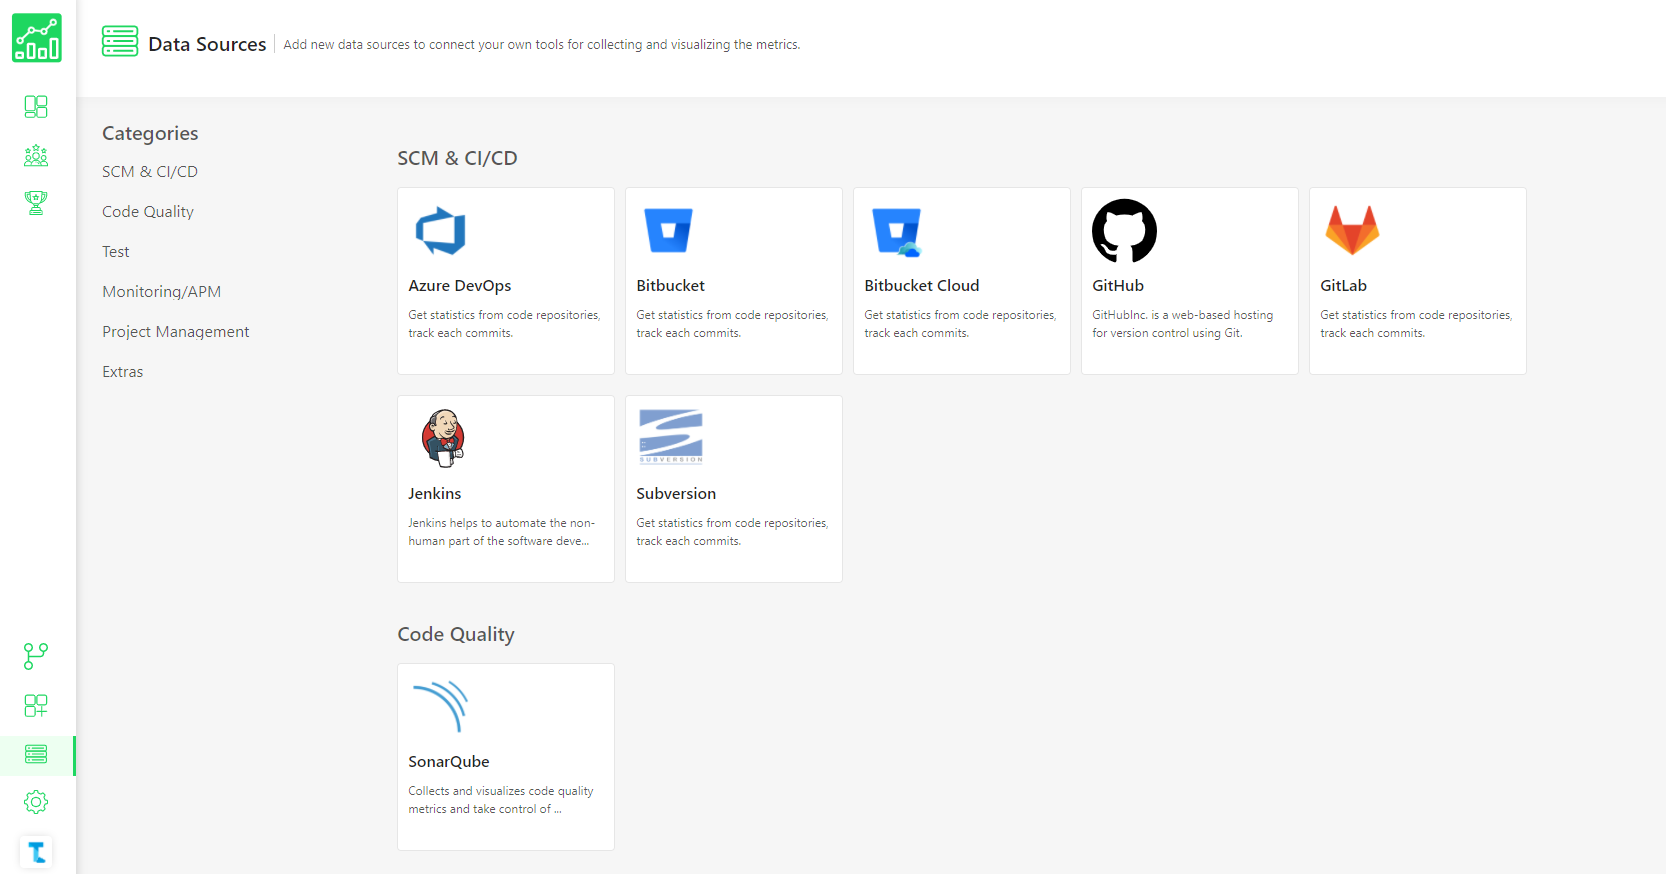
![](https://firebasestorage.googleapis.com/v0/b/gitbook-x-prod.appspot.com/o/spaces%2F-MGIlBSTjQtZxUoFwUx4%2Fuploads%2FLnn6JjQV3N0oVT2VuLZj%2Ffile.png?alt=media)

## **ADDING A NEW DATA SOURCE**:electric\_plug:&#x20;

1\. Navigate to **Data Sources**.&#x20;

![](https://firebasestorage.googleapis.com/v0/b/gitbook-x-prod.appspot.com/o/spaces%2F-MGIlBSTjQtZxUoFwUx4%2Fuploads%2Fk0l4xogFxAgSX8XsLGbn%2Ffile.png?alt=media)

2\. Click the addon that you want to connect.

3\. Click **"New Data Source"** button and fill in the form.&#x20;

![](https://firebasestorage.googleapis.com/v0/b/gitbook-x-prod.appspot.com/o/spaces%2F-MGIlBSTjQtZxUoFwUx4%2Fuploads%2FbwaOpjP1b3ANToIRPrxB%2Ffile.png?alt=media)

See the articles below for detailed information about the integrations:

* [Azure DevOps](/integrations/all-integrations/scm-addons/azure-devops-integration) & Oobeya Integration
* [Bitbucket Server](/integrations/all-integrations/scm-addons/bitbucket-server-integration) & Oobeya Integration
* [Bitbucket Cloud](/integrations/all-integrations/scm-addons/bitbucket-cloud-integration) & Oobeya Integration
* [GitHub](/integrations/all-integrations/scm-addons/github-integrations) & Oobeya Integration
* [GitLab](/integrations/all-integrations/scm-addons/gitlab-addon) & Oobeya Integration
* [Jenkins](/integrations/all-integrations/scm-addons/jenkins-integration) & Oobeya Integration
* [SonarQube](/integrations/all-integrations/code-quality-addons/sonarqube-integration) & Oobeya Integration


# Updating and Deleting Data Sources

Learn about how to manage existing Data Sources...

## **OVERVIEW**

There are some cases that cause data source corruption. Therefore, you may need to manage your existing Data Sources.

* Tokens that you generated may be expired,
* The Domain name of the server you saved may be changed,
* The credentials of the user may be changed...

## **1. UPDATING DATA SOURCES** :pencil2:&#x20;

1. Navigate to **Data Sources**.
2. Select the addon that you want to update.&#x20;

![](https://firebasestorage.googleapis.com/v0/b/gitbook-x-prod.appspot.com/o/spaces%2F-MGIlBSTjQtZxUoFwUx4%2Fuploads%2FRu1CubbXnWg3WXuSRwAI%2Ffile.png?alt=media)

3\. Click the *edit icon* and edit the data in the form.&#x20;

![](https://firebasestorage.googleapis.com/v0/b/gitbook-x-prod.appspot.com/o/spaces%2F-MGIlBSTjQtZxUoFwUx4%2Fuploads%2FQhV76Ukq9Iz0g9LcfwED%2Ffile.png?alt=media)

4\. Click the **"Update"** button to save the changes.

## **2. DELETING DATA SOURCES** :x:&#x20;

If you want to **delete a data source permanently**, follow the steps below:

1. Navigate to **Data Sources**.
2. Select the addon whose data source you want to delete.
3. Click the *delete icon* to delete the data source.&#x20;

![](https://firebasestorage.googleapis.com/v0/b/gitbook-x-prod.appspot.com/o/spaces%2F-MGIlBSTjQtZxUoFwUx4%2Fuploads%2FxrU8LL01QSpFDqrXQtNH%2Ffile.png?alt=media)

4\. Confirm the name of the data source you want to delete and click the **"Delete Data Source"** button.&#x20;

![](https://firebasestorage.googleapis.com/v0/b/gitbook-x-prod.appspot.com/o/spaces%2F-MGIlBSTjQtZxUoFwUx4%2Fuploads%2Fsld8HefvW3NKQQPsdnSk%2Ffile.png?alt=media)

## **WHAT'S NEXT?** :dart:&#x20;

* [Adding a New Data Source](/integrations/adding-new-integration/adding-a-new-data-source)


# Network Access Requirements

Requests are made using the HTTP protocol via REST API calls.

The Oobeya server must be able to reach the following addresses as **outbound** traffic during initial setup and ongoing operation.

### 1. Image and Configuration File Access

| Purpose                                     | Address                                   | Port | Protocol |
| ------------------------------------------- | ----------------------------------------- | ---- | -------- |
| Container images (Azure Container Registry) | oobeya.germanywestcentral.data.azurecr.io | 443  | HTTPS    |
| Container images (Azure Container Registry) | oobeya.azurecr.io                         | 443  | HTTPS    |
| File/configuration repository (AWS S3)      | oobeya-app.s3.amazonaws.com               | 443  | HTTPS    |

### 2. Addon Tool Access (Outbound)

The Oobeya server must be able to reach the API or service addresses of the addon tools in use as outbound traffic:

| Category               | Addon Name                          | Deployment Type          | Default Port (No DNS/HTTPS) | Port (with DNS/HTTPS) | Protocol     |
| ---------------------- | ----------------------------------- | ------------------------ | --------------------------- | --------------------- | ------------ |
| **Project Management** | Jira Cloud                          | Cloud                    | —                           | 443                   | HTTPS        |
| **Project Management** | Jira Server / Data Center           | Server, Data Center      | 8080                        | 443                   | HTTP/HTTPS   |
| **Documentation**      | Confluence                          | Server, Data Center      | 8090                        | 443                   | HTTP/HTTPS   |
| **SCM & CI/CD & PM**   | Azure DevOps Cloud                  | Cloud                    | —                           | 443                   | HTTPS        |
| **SCM & CI/CD & PM**   | Azure DevOps Server                 | Server                   | 8080                        | 443                   | HTTP/HTTPS   |
| **SCM & CI/CD**        | GitHub Cloud                        | Cloud, Enterprise Cloud  | —                           | 443                   | HTTPS        |
| **SCM & CI/CD**        | GitHub Enterprise Server            | Enterprise On-premise    | 443                         | 443                   | HTTPS        |
| **SCM & CI/CD**        | GitLab Cloud                        | Cloud                    | —                           | 443                   | HTTPS        |
| **SCM & CI/CD**        | GitLab Self-Managed                 | Self Managed, Enterprise | 80                          | 443                   | HTTP/HTTPS   |
| **SCM & CI/CD**        | Bitbucket Cloud                     | Cloud                    | —                           | 443                   | HTTPS        |
| **SCM & CI/CD**        | Bitbucket Server / Data Center      | Server, Data Center      | 7990                        | 443                   | HTTP/HTTPS   |
| **SCM & CI/CD**        | Gitea                               | Server                   | 3000                        | 443                   | HTTP/HTTPS   |
| **SCM & CI/CD**        | Gerrit Cloud                        | Cloud                    | —                           | 443                   | HTTPS        |
| **SCM & CI/CD**        | Gerrit Server                       | Server                   | 8080                        | 443                   | HTTP/HTTPS   |
| **SCM & CI/CD**        | ArgoCD                              | Server                   | 8080                        | 443                   | HTTP/HTTPS   |
| **SCM & CI/CD**        | Jenkins                             | Server                   | 8080                        | 443                   | HTTP/HTTPS   |
| **SCM & CI/CD**        | CloudBees                           | Server                   | 8080                        | 443                   | HTTP/HTTPS   |
| **SCM & CI/CD**        | TeamCity Cloud                      | Cloud                    | —                           | 443                   | HTTPS        |
| **SCM & CI/CD**        | TeamCity Server                     | Server                   | 8111                        | 443                   | HTTP/HTTPS   |
| **SCM & CI/CD**        | Octopus Deploy Cloud                | Cloud                    | —                           | 443                   | HTTPS        |
| **SCM & CI/CD**        | Octopus Deploy Server               | Server                   | 8080                        | 443                   | HTTP/HTTPS   |
| **Quality & Security** | SonarQube Server                    | Server                   | 9000                        | 443                   | HTTP/HTTPS   |
| **Quality & Security** | SonarQube Cloud                     | Cloud                    | —                           | 443                   | HTTPS        |
| **Quality & Security** | Fortify                             | Server                   | 8080                        | 443                   | HTTP/HTTPS   |
| **Quality & Security** | Veracode                            | Cloud                    | —                           | 443                   | HTTPS        |
| **Quality & Security** | Xray Cloud (Jira Cloud)             | Cloud                    | —                           | 443                   | HTTPS        |
| **Quality & Security** | Xray Server / DC (Jira Server / DC) | Server / DC              | 8080                        | 443                   | HTTP/HTTPS   |
| **Monitoring & APM**   | Azure Application Insights          | Cloud                    | —                           | 443                   | HTTPS        |
| **Monitoring & APM**   | New Relic                           | Cloud                    | —                           | 443                   | HTTPS        |
| **Monitoring & APM**   | Datadog                             | Cloud                    | —                           | 443                   | HTTPS        |
| **Authentication**     | Microsoft Entra (Azure AD)          | Cloud                    | —                           | 443                   | HTTPS        |
| **Authentication**     | Okta                                | Cloud                    | —                           | 443                   | HTTPS        |
| **Authentication**     | LDAP                                | Server                   | 389 / 636                   | —                     | LDAP / LDAPS |

> **Note:** If the addon is accessed via DNS/domain with HTTPS, port 443 is opened. If DNS/HTTPS is not configured, the application's default port must be used instead. For Server/Data Center addons, the organization may have changed the default port during installation; in that case, access must be opened on the actual configured port. For addons running in **public/cloud environments**, access must be defined through **IP/domain whitelisting** rather than opening broad access — this applies to both outbound (this section) and inbound (Section 3) rules. The specific IP ranges or domains should be obtained from each provider's official documentation.

### 3. Adding the Oobeya Server to Addon Inbound Rules

The Oobeya server's access must be defined in the inbound settings of the addon tools in use:

| Category               | Addon Name                          | Deployment Type          | Default Port (No DNS/HTTPS) | Port (with DNS/HTTPS) | Protocol     |
| ---------------------- | ----------------------------------- | ------------------------ | --------------------------- | --------------------- | ------------ |
| **Project Management** | Jira Cloud                          | Cloud                    | —                           | 443                   | HTTPS        |
| **Project Management** | Jira Server / Data Center           | Server, Data Center      | 8080                        | 443                   | HTTP/HTTPS   |
| **Documentation**      | Confluence                          | Server, Data Center      | 8090                        | 443                   | HTTP/HTTPS   |
| **SCM & CI/CD & PM**   | Azure DevOps Cloud                  | Cloud                    | —                           | 443                   | HTTPS        |
| **SCM & CI/CD & PM**   | Azure DevOps Server                 | Server                   | 8080                        | 443                   | HTTP/HTTPS   |
| **SCM & CI/CD**        | GitHub Cloud                        | Cloud, Enterprise Cloud  | —                           | 443                   | HTTPS        |
| **SCM & CI/CD**        | GitHub Enterprise Server            | Enterprise On-premise    | 443                         | 443                   | HTTPS        |
| **SCM & CI/CD**        | GitLab Cloud                        | Cloud                    | —                           | 443                   | HTTPS        |
| **SCM & CI/CD**        | GitLab Self-Managed                 | Self Managed, Enterprise | 80                          | 443                   | HTTP/HTTPS   |
| **SCM & CI/CD**        | Bitbucket Cloud                     | Cloud                    | —                           | 443                   | HTTPS        |
| **SCM & CI/CD**        | Bitbucket Server / Data Center      | Server, Data Center      | 7990                        | 443                   | HTTP/HTTPS   |
| **SCM & CI/CD**        | Gitea                               | Server                   | 3000                        | 443                   | HTTP/HTTPS   |
| **SCM & CI/CD**        | Gerrit Cloud                        | Cloud                    | —                           | 443                   | HTTPS        |
| **SCM & CI/CD**        | Gerrit Server                       | Server                   | 8080                        | 443                   | HTTP/HTTPS   |
| **SCM & CI/CD**        | ArgoCD                              | Server                   | 8080                        | 443                   | HTTP/HTTPS   |
| **SCM & CI/CD**        | Jenkins                             | Server                   | 8080                        | 443                   | HTTP/HTTPS   |
| **SCM & CI/CD**        | CloudBees                           | Server                   | 8080                        | 443                   | HTTP/HTTPS   |
| **SCM & CI/CD**        | TeamCity Cloud                      | Cloud                    | —                           | 443                   | HTTPS        |
| **SCM & CI/CD**        | TeamCity Server                     | Server                   | 8111                        | 443                   | HTTP/HTTPS   |
| **SCM & CI/CD**        | Octopus Deploy Cloud                | Cloud                    | —                           | 443                   | HTTPS        |
| **SCM & CI/CD**        | Octopus Deploy Server               | Server                   | 8080                        | 443                   | HTTP/HTTPS   |
| **Quality & Security** | SonarQube Server                    | Server                   | 9000                        | 443                   | HTTP/HTTPS   |
| **Quality & Security** | SonarQube Cloud                     | Cloud                    | —                           | 443                   | HTTPS        |
| **Quality & Security** | Fortify                             | Server                   | 8080                        | 443                   | HTTP/HTTPS   |
| **Quality & Security** | Veracode                            | Cloud                    | —                           | 443                   | HTTPS        |
| **Quality & Security** | Xray Cloud (Jira Cloud)             | Cloud                    | —                           | 443                   | HTTPS        |
| **Quality & Security** | Xray Server / DC (Jira Server / DC) | Server / DC              | 8080                        | 443                   | HTTP/HTTPS   |
| **Monitoring & APM**   | Azure Application Insights          | Cloud                    | —                           | 443                   | HTTPS        |
| **Monitoring & APM**   | New Relic                           | Cloud                    | —                           | 443                   | HTTPS        |
| **Monitoring & APM**   | Datadog                             | Cloud                    | —                           | 443                   | HTTPS        |
| **Authentication**     | Microsoft Entra (Azure AD)          | Cloud                    | —                           | 443                   | HTTPS        |
| **Authentication**     | Okta                                | Cloud                    | —                           | 443                   | HTTPS        |
| **Authentication**     | LDAP                                | Server                   | 389 / 636                   | —                     | LDAP / LDAPS |

> **Note:** Same default port and DNS/HTTPS principles apply here as in Section 2. The whitelisting requirement for public/cloud environments described above applies equally to inbound rules.


# Proactive Issue Detection (Engineering Insights)

Automatically detect inefficiencies with Oobeya's Symptoms.

### Spot Problems Before They Become Bottlenecks

Instead of overwhelming dashboards and vague metrics, Oobeya highlights what truly matters: **the bottlenecks slowing down your teams**. From [unreviewed pull requests ](/team-insights-and-symptoms/symptoms-catalog/s9-unreviewed-pull-requests)to [high lead times](/team-insights-and-symptoms/symptoms-catalog/s12-high-lead-time-for-changes-dora), Symptoms proactively surface engineering issues, along with actionable recommendations to fix them.

***

{% stepper %}
{% step %}

#### **Stop guesswork — get instant visibility into real problems**

Symptoms automatically surface issues like delayed reviews, excessive rework, or low-quality code, so you don’t need to dig through dashboards or reports.
{% endstep %}

{% step %}

#### **Move from metrics to meaningful actions**

Each symptom includes contextual insights and tailored improvement suggestions — enabling your teams to act quickly and effectively.
{% endstep %}

{% step %}

#### **Empower teams to take ownership of their delivery**

Teams see their signals in real-time, understand what needs attention, and develop a habit of continuous improvement without micromanagement.
{% endstep %}
{% endstepper %}

<p align="center"><a href="https://oobeya.io/schedule-a-demo" class="button primary">New to Oobeya? Explore Symptoms In Action ></a></p>

***

Symptoms are intelligent signals derived from your engineering data — highlighting code, process, or collaboration issues before they impact delivery.&#x20;
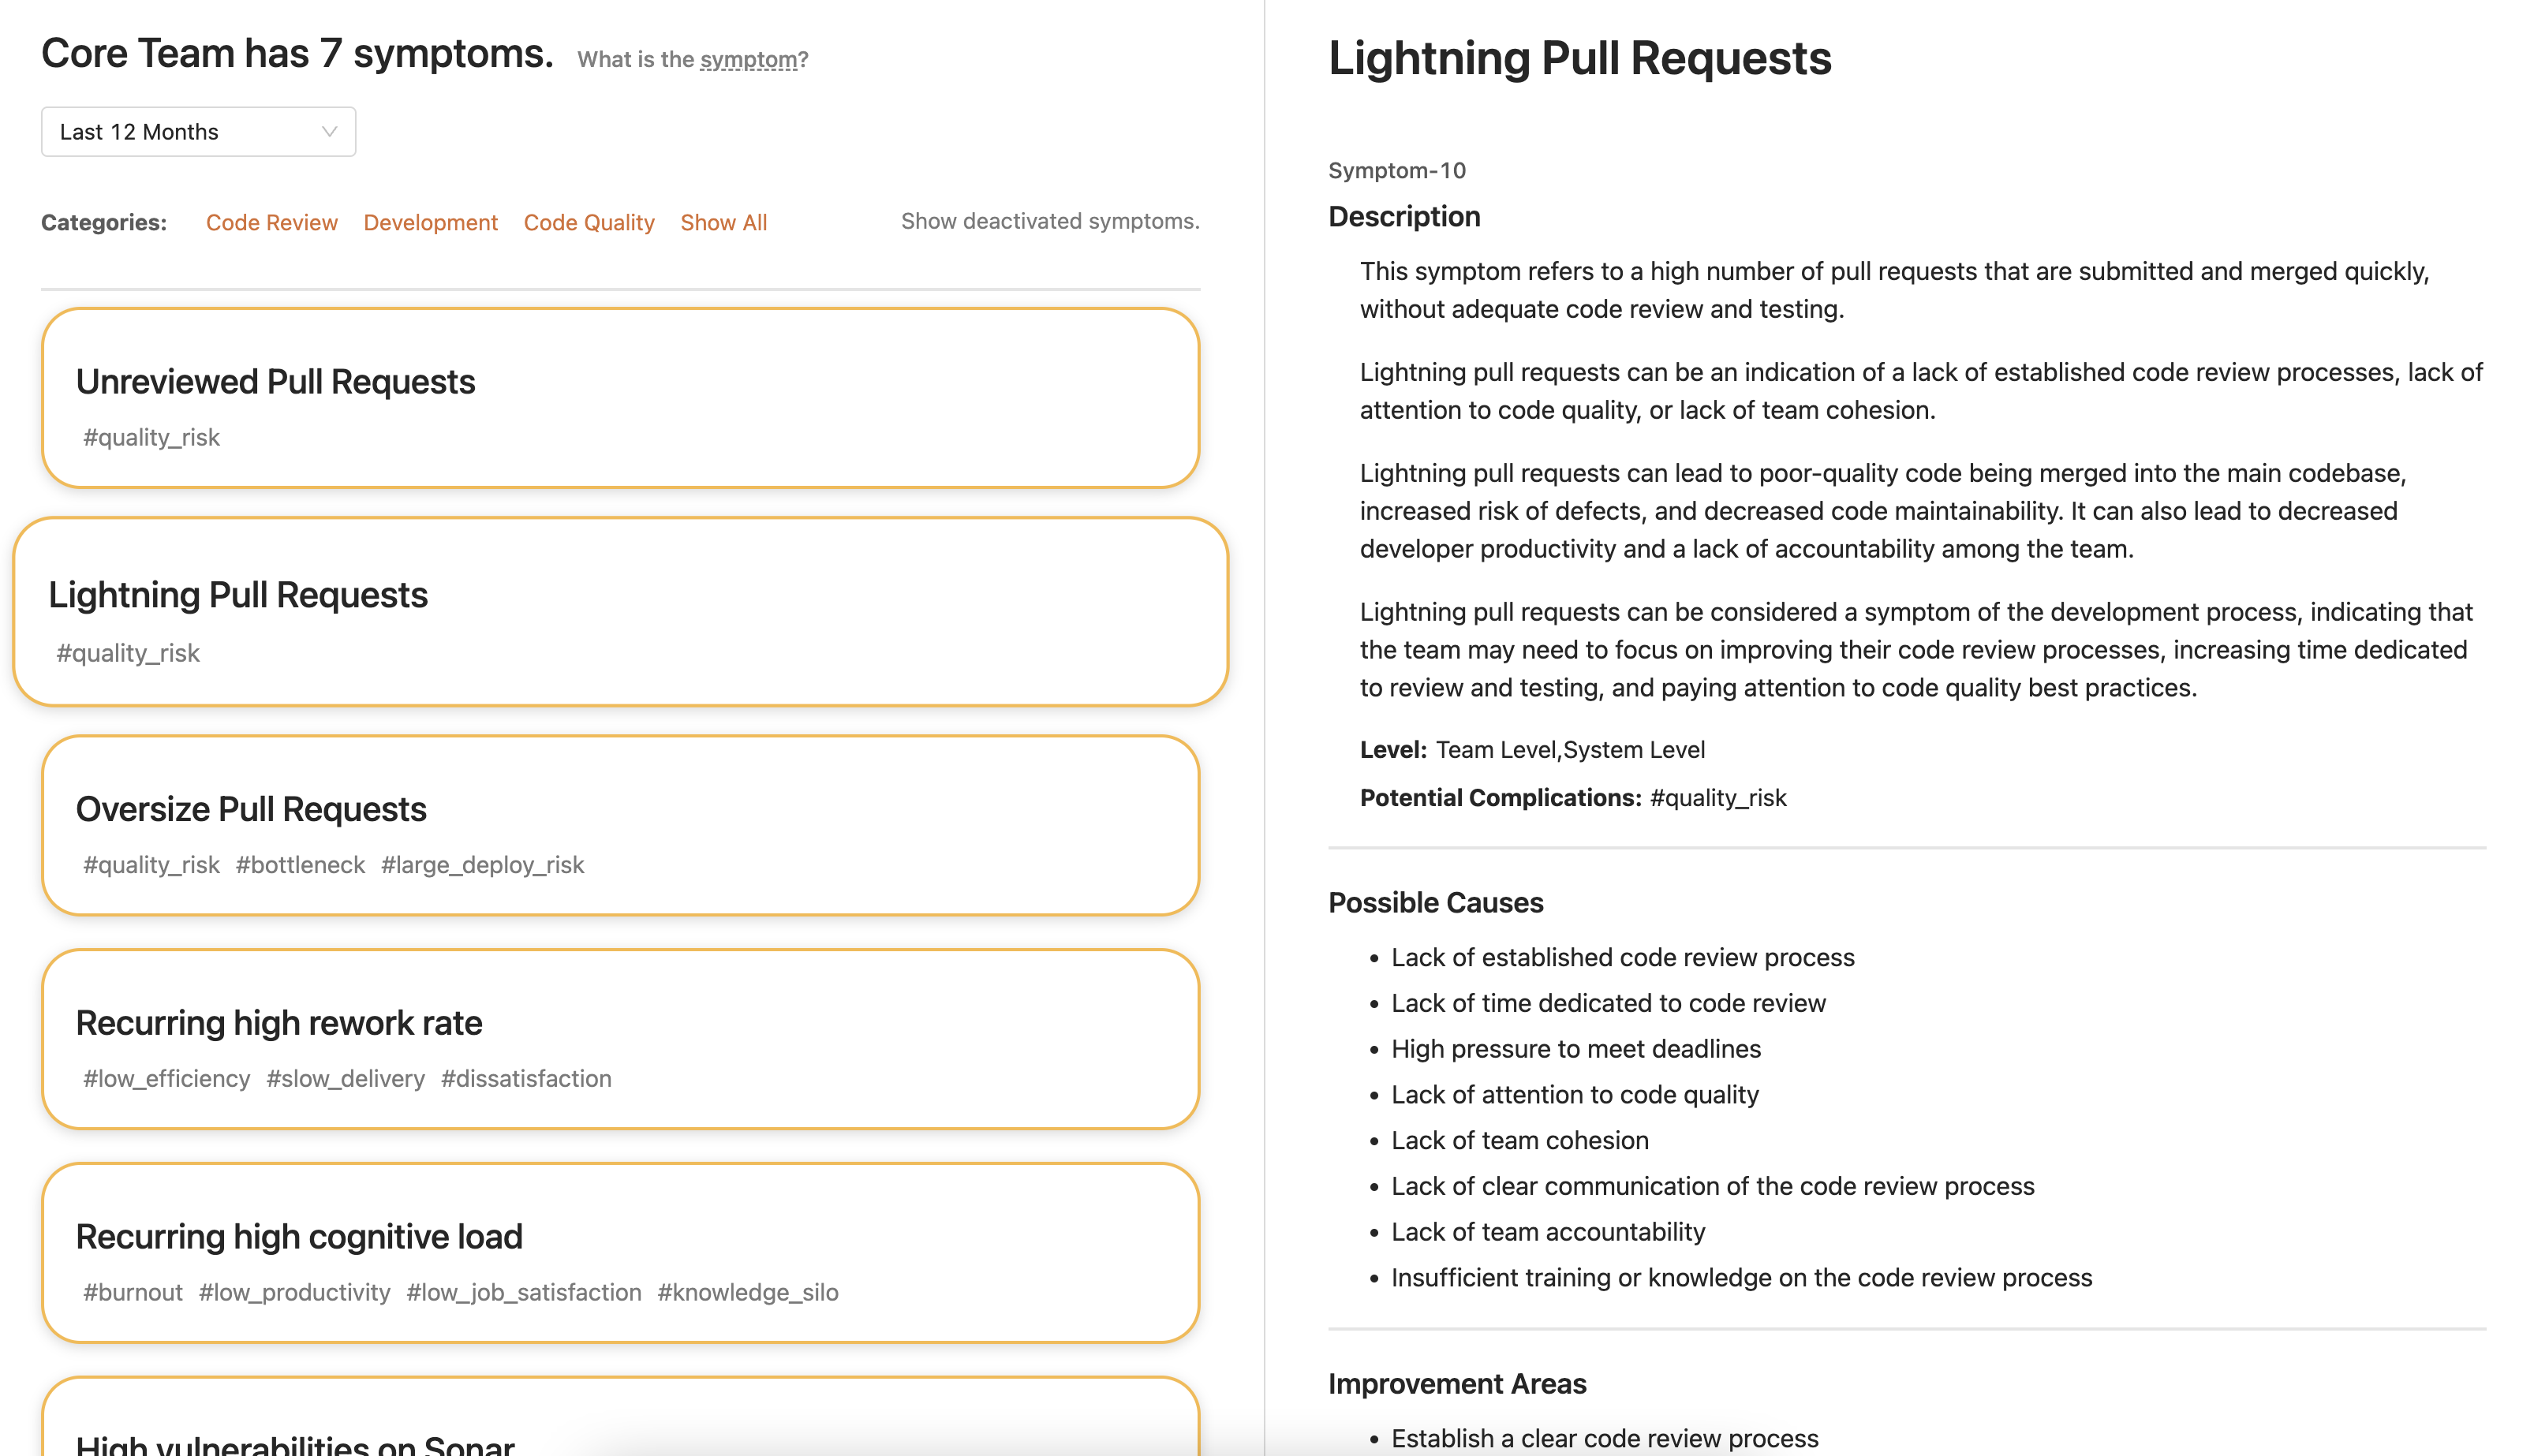
<figure><img src="https://3582076375-files.gitbook.io/~/files/v0/b/gitbook-x-prod.appspot.com/o/spaces%2F-MGIlBSTjQtZxUoFwUx4%2Fuploads%2FTE7FOZBwlA2icSzESxrP%2Fimage.png?alt=media&amp;token=21bf687a-bc10-4a4d-9f62-bc16979341f1" alt=""><figcaption><p>Oobeya Symptoms</p></figcaption></figure>

***

:information\_source: **View the full Symptoms documentation:**

{% content-ref url="/pages/iC3Pu9PvQtawPG8MGl8Z" %}
[Symptoms Catalog](/team-insights-and-symptoms/symptoms-catalog)
{% endcontent-ref %}


# Optimizing Team and Resource Utilization

Gain visibility into how your engineering resources is distributed and used across projects.

### **Struggling with overloaded developers and underused team members?**

You’re not alone. Misaligned resource distribution silently kills team efficiency — delaying delivery, increasing burnout, and wasting potential.

Balance your teams, understand workload distribution, and identify inefficiencies across internal and outsourced contributors. Oobeya helps you visualize effort and capacity across the entire organization, enabling data-driven planning and smarter investments.

***

{% stepper %}
{% step %}

#### Spot underused or overloaded teams instantly

Gain a clear view of workload distribution to identify burnout risks or underutilized teams — before they impact delivery or morale.
{% endstep %}

{% step %}

#### Evaluate third-party performance with data

Track contributions and impact from external vendors or contractors to ensure accountability and alignment with internal teams.
{% endstep %}

{% step %}

#### Align hiring, outsourcing, and project planning

Use real-time insights to guide team expansion, reallocation, or vendor decisions — based on actual capacity and business needs.
{% endstep %}
{% endstepper %}

<p align="center"><a href="https://oobeya.io/contact" class="button primary">First time here? Start optimizing resources using Oobeya ></a></p>

***

<figure><img src="https://3582076375-files.gitbook.io/~/files/v0/b/gitbook-x-prod.appspot.com/o/spaces%2F-MGIlBSTjQtZxUoFwUx4%2Fuploads%2F3r0TB3AGR9HFPAxoL6t8%2Fimage.png?alt=media&amp;token=62870473-afab-41ee-94ef-b0725e2905c1" alt=""><figcaption></figcaption></figure>

***

### How To Get Started <a href="#prerequisites" id="prerequisites"></a>

Before using the Resource Allocation module, make sure the following conditions are met:

* **Project Management tool integration is active**: The module pulls data from the project management tools like Jira or Azure Boards via Oobeya's AgileSpace module.
* **Projects are analyzed on AgileSpace**: Ensure your Jira or Azure Boards projects are being actively analyzed in AgileSpace.
* **Contributor Profiles are created**: Every contributor involved in project delivery work must have a contributor profile in Oobeya.
* **Accounts are merged (if needed)**: Duplicate Jira/Azure Boards accounts should be merged to avoid miscalculations.
* **Relevant roles are configured**: Only selected roles (e.g., Developer) are included in allocation calculations. Roles can be managed via `Administration > Resource Allocations`. [See the details](https://docs.oobeya.io/allocations/resource-allocation#admin-settings).
* **Exclude unnecessary work item types**: Go to `Administration > AgileSpace > Work Item Type Exclusion` to exclude irrelevant work item types (e.g., questions, comments) from the analysis to improve accuracy.

***

:information\_source: **Go to the full documentation of this module:**

{% content-ref url="/pages/YD1P48gXJzSERe2xIjAi" %}
[Resource Allocation](/allocations/resource-allocation)
{% endcontent-ref %}


# Gamification for Engineering KPIs

Drive performance through visibility and recognition.

### What is Gamification in Software Engineering?

**Gamification** refers to applying game design elements — such as goals, feedback, competition, and rewards — to non-game contexts. In software engineering, it means helping teams engage with their performance metrics in a transparent, collaborative, and motivating way.

Gamification isn’t about turning work into play. It’s about utilizing motivational techniques and transparent feedback loops to promote accountability, drive improvement, and facilitate data-driven coaching. When paired with **Engineering KPIs**, it becomes a powerful strategy for optimizing performance.

***

### Motivate Teams with Transparent Scoring

Turn **engineering KPIs** into a source of motivation with **Oobeya’s Gamification module**. Track progress, foster healthy competition, and celebrate achievements through automated scorecards, team leagues, and customizable performance rules — all powered by real engineering data.

***

{% stepper %}
{% step %}

#### **Align goals with measurable outcomes**

Define **what success looks like** using clear, data-driven scoring rules tied to engineering KPIs such as review responsiveness, delivery speed, and code quality.
{% endstep %}

{% step %}

#### Make performance fun, visible, and rewarding

Introduce **healthy competition** **between teams** with transparent scoreboards, weekly rounds, and league-style rankings that engage without adding pressure.
{% endstep %}

{% step %}

#### Recognize achievements and promote engagement

Automatically highlight top performers and most improved teams to **reinforce positive behaviors** and **boost morale**.
{% endstep %}
{% endstepper %}

<p align="center"><a href="https://oobeya.io/schedule-a-demo" class="button primary">Learn how to gamify your KPIs ></a></p>

***

### Why Gamification Matters for Engineering Leaders?

With distributed teams and increasingly complex delivery pipelines, leaders need better tools for visibility, alignment, and performance management.

* **Data Transparency:** Real-time insight into individual and team performance
* **Alignment**: Shared KPIs help teams align on what success looks like
* **Ownership**: Developers take more responsibility when they see their impact
* **Better Coaching**: Leaders can identify trends and coach without micromanaging
* **Higher Engagement**: Teams stay motivated by seeing and celebrating progress

<figure><img src="https://3582076375-files.gitbook.io/~/files/v0/b/gitbook-x-prod.appspot.com/o/spaces%2F-MGIlBSTjQtZxUoFwUx4%2Fuploads%2FHxqtl9kUbZoescNlLyHO%2Fimage.png?alt=media&amp;token=82ae69cf-b735-4068-9a28-2a236f56b75c" alt=""><figcaption><p>Oobeya Gamification</p></figcaption></figure>

***

:information\_source: **View the full Gamification documentation:**

{% content-ref url="/pages/juOVW0AcVO9NQZATukec" %}
[Gamification](/gamification/gamification)
{% endcontent-ref %}


# Measuring the Impact of AI Coding Assistants

Track adoption, usage patterns, and efficiency gains of AI-powered coding assistants like GitHub Copilot.

### Maximize the value of your AI investments

AI Coding Assistant tools like GitHub Copilot promise productivity gains, but are they truly delivering for your teams?\
Oobeya’s **AI Coding Assistant Impact** module turns that question into measurable answers.\
Track adoption, engagement, and acceptance trends across your organization so you can maximize the value of your AI investments.

***

{% stepper %}
{% step %}

#### **Encourage adoption where it's low**

Identify teams or languages with minimal AI assistant usage and apply targeted onboarding or awareness initiatives to boost adoption rates.
{% endstep %}

{% step %}

#### **Provide targeted enablement for teams struggling with usage**

Use detailed engagement and acceptance data to pinpoint skill gaps and deliver focused training, ensuring teams use AI assistants effectively.
{% endstep %}

{% step %}

#### **Measure the ROI of your AI assistant investment**

Link adoption and engagement metrics to measurable productivity gains, proving the business value of your AI assistant deployment.
{% endstep %}
{% endstepper %}

<p align="center"><a href="https://oobeya.io/schedule-a-demo" class="button primary">Explore AI Impact Dashboard ></a></p>

***

### 1. **Why Measure AI Coding Assistant Impact?**

AI assistants are rapidly entering the developer workflow — but adoption doesn’t always equal impact.\
Without visibility, you can’t answer key questions:

* Are developers actively using AI assistants?
* How often do they accept suggestions?
* Which teams benefit most?
* Are we seeing a measurable productivity gain?

> **Oobeya gives you a clear, data-backed answer to all of these questions in one place.**

<figure><img src="https://3582076375-files.gitbook.io/~/files/v0/b/gitbook-x-prod.appspot.com/o/spaces%2F-MGIlBSTjQtZxUoFwUx4%2Fuploads%2F0twBtIb5vHDW80701RjV%2Fimage.png?alt=media&amp;token=7c64a840-8463-47b5-b446-07298f8d158d" alt=""><figcaption><p>Copilot Adoption Over Time</p></figcaption></figure>

{% hint style="info" %}
**Copilot Adoption Over Time:** Tracks the number of active and engaged users compared to the total licensed users over time. This chart helps you measure adoption rate and license utilization across teams.
{% endhint %}

***

### **2. Track Adoption & Engagement**

Understand how widely AI assistants are being used in your organization.

* **Active Users:** Number of users who have Copilot installed and interacted with it.
* **Engaged Users:** Number of users who accepted at least one Copilot suggestion.
* **Adoption Rate:** Ratio of engaged users to active users: Engaged Users / Active Users

> *Example:* In the last 90 days, adoption reached **73.33%** with a **+560% increase** in active users.

***

### **3. Measure Usage Quality, Not Just Quantity**

Go beyond “who uses it” — see “how well it’s used.”\
Track:

* **Total Suggestions vs. Accepted Suggestions**
* **Acceptance Rate by Suggestions**
* **Acceptance Rate by Lines of Code**

> *Example:* 74.3K suggestions → 22.1K accepted → **29.79% acceptance rate**.

<figure><img src="https://3582076375-files.gitbook.io/~/files/v0/b/gitbook-x-prod.appspot.com/o/spaces%2F-MGIlBSTjQtZxUoFwUx4%2Fuploads%2FGZjzfmmVvw00fo8goO8d%2Fimage.png?alt=media&amp;token=09d63f63-1734-46ad-b048-7319447e1ea9" alt=""><figcaption><p>Copilot Engagement &#x26; Acceptance Trends</p></figcaption></figure>

***

### **4. Analyze by Language & IDE**

Find where AI assistants deliver the most value:

* Which programming languages have the highest acceptance rates?
* Which IDEs see the most usage?
* Are there teams or languages where adoption is low?

> *Example:* C# leads in usage with 51.9% acceptance for suggestions.

<figure><img src="https://3582076375-files.gitbook.io/~/files/v0/b/gitbook-x-prod.appspot.com/o/spaces%2F-MGIlBSTjQtZxUoFwUx4%2Fuploads%2FiosF6KSIzDsql7OPQGQj%2Fimage.png?alt=media&amp;token=67210271-1f75-4858-8a8e-88aca3b6877f" alt=""><figcaption><p>Copilot Usage by Language(Top 5) &#x26; Editor</p></figcaption></figure>

{% hint style="info" %}
**Copilot Usage by Language(Top 5) & Editor:** Visualizes Copilot usage by the top 5 most active programming languages and development editors. This widget helps identify where Copilot is most frequently triggered.
{% endhint %}

***

### **5. Feature Usage Insights**

Identify the most impactful AI features:

* In-IDE code completions
* Chat-based interactions (GitHub.com, IDE chat)
* Pull request integrations

> *Example:* IDE code completions dominate usage compared to chat and PR suggestions.

<figure><img src="https://3582076375-files.gitbook.io/~/files/v0/b/gitbook-x-prod.appspot.com/o/spaces%2F-MGIlBSTjQtZxUoFwUx4%2Fuploads%2F6x7yUHEcrXsqjKmOn29f%2Fimage.png?alt=media&amp;token=46d6e5af-5fb8-4b53-a95a-1881beda680d" alt=""><figcaption><p>Copilot Feature Usage Over Time</p></figcaption></figure>

{% hint style="info" %}
**Copilot Feature Usage Over Time:** Shows usage trends of various Copilot features (IDE Code Completions, Chat, PR) across time periods.
{% endhint %}

***

### 6. **Team & User-Level Metrics**

Pinpoint your most engaged teams and identify where training is needed:

* Most active team
* Most efficient usage team
* Users with no activity in the last 7 or 30 days

<figure><img src="https://3582076375-files.gitbook.io/~/files/v0/b/gitbook-x-prod.appspot.com/o/spaces%2F-MGIlBSTjQtZxUoFwUx4%2Fuploads%2FbSEsZ7Ypa1BvhysjArlU%2Fimage.png?alt=media&amp;token=a6f162b8-f002-47ca-be0b-74e5559e0568" alt=""><figcaption><p><strong>Team Usage Metrics</strong></p></figcaption></figure>

{% hint style="info" %}
**Team Usage Metrics:** A per-team breakdown of AI assistant usage, including activation, engagement, and suggestion effectiveness.
{% endhint %}

<figure><img src="https://3582076375-files.gitbook.io/~/files/v0/b/gitbook-x-prod.appspot.com/o/spaces%2F-MGIlBSTjQtZxUoFwUx4%2Fuploads%2FGKaaqJuDgkyPQmM2aVGQ%2Fimage.png?alt=media&amp;token=f61fbd78-6cce-4b0e-9912-2d5f693f68fe" alt=""><figcaption><p>Copilot Seats, User-Level Metrics - Users with no activity in the last 7 or 30 days</p></figcaption></figure>

***

<p align="center"><a href="https://oobeya.io/schedule-a-demo" class="button primary">Explore AI Impact Dashboard ></a></p>


# Measuring and Improving Test Efficiency with Oobeya Test Analytics

Boost testing efficiency and performance with Oobeya Test Analytics. Combine test management (Xray, TestRail) and automation data to improve the overall quality and productivity of teams.

### Turn your testing data into actionable insights!

Testing is one of the most critical — and often least measured — stages of the software delivery lifecycle.

Manual testing, automation pipelines, and user acceptance tests (UAT) all produce large amounts of data, yet teams rarely have a clear picture of **how efficiently** testing contributes to release quality.

Oobeya’s **Test Analytics module** brings all your testing data — from test management tools (Xray, Zephyr, TestRail, Azure DevOps Test) and external test automation tools (via REST API) — into one place, allowing you to track test efficiency, escaped defects, and overall test coverage.

***

{% stepper %}
{% step %}

#### **Connect your testing ecosystem**

Integrate your manual and automation test tools — Jira Xray, Zephyr, TestRail, Jenkins, and others — to consolidate all test execution data in Oobeya.
{% endstep %}

{% step %}

#### **Measure real test efficiency**

Track pass rates, defect leakage, and automation coverage to identify whether your testing processes are improving release quality — not just increasing test volume.
{% endstep %}

{% step %}

#### **Find where quality issues originate**

Drill down by project, team, or phase to uncover systemic weaknesses such as high defect escape rates, long UAT cycles, or low automation success.
{% endstep %}
{% endstepper %}

<p align="center"><a href="https://oobeya.io/schedule-a-demo" class="button primary">Explore Test Analytics ></a></p>

***

### 1. **Why Measure Test Efficiency?**

Without visibility into testing performance, engineering teams struggle to answer key questions:

* Are we catching defects early enough?
* Is automation reducing UAT duration?
* Which teams have the highest defect leakage?
* Is our testing effort aligned with release quality?

> **Oobeya provides data-driven answers to these questions by combining manual and automated test results into one unified analytics view.**

<figure><img src="https://3582076375-files.gitbook.io/~/files/v0/b/gitbook-x-prod.appspot.com/o/spaces%2F-MGIlBSTjQtZxUoFwUx4%2Fuploads%2FZfqLmXRXFjfAkPH8qESS%2Fimage.png?alt=media&amp;token=20190ad4-500f-4655-8954-46cb044401d1" alt=""><figcaption><p>Test Analytics Dashboard – Manual &#x26; Automation Test Insights</p></figcaption></figure>

***

### 2. **Connect and Analyze All Test Sources**

Oobeya integrates seamlessly with both **manual** and **automated** test systems.

* **Manual (Xray, Zephyr, TestRail)** – Import test runs, UAT mappings, and test case results from [Jira Xray](https://marketplace.atlassian.com/apps/1211769/xray-test-management-for-jira).
* **Automation (Jenkins, CI/CD, Test Automation tools)** – Collect automated test executions, coverage, and defect data via API.
* **Unified Analysis** – Combine results from all sources to understand full test efficiency across the SDLC.

> 🔗 Learn [how to connect Jira Xray](/integrations/all-integrations/code-quality-addons/xray-integration).

***

### 3. **Key Metrics Tracked**

Oobeya aggregates and visualizes test performance at both the **organization** and **team** levels.

<table><thead><tr><th width="275.1964111328125">Metric</th><th>Description</th></tr></thead><tbody><tr><td><strong>Test Efficiency (%)</strong></td><td>Percentage of successful tests across all runs.</td></tr><tr><td><strong>Escaped Defects (%)</strong></td><td>Ratio of bugs discovered after UAT completion.</td></tr><tr><td><strong>Automation Coverage (%)</strong></td><td>Share of code covered by automated tests.</td></tr><tr><td><strong>UAT Success Rate (%)</strong></td><td>Success ratio of user acceptance testing.</td></tr><tr><td><strong>Defect Resolution Rate (%)</strong></td><td>Percentage of defects resolved during the test cycle.</td></tr><tr><td><strong>Execution Time (ms)</strong></td><td>Average time per test execution.</td></tr></tbody></table>

These metrics appear in team dashboards, organization overviews, and scorecards — with threshold colors defined in Admin Settings.

***

### 4. **Team-Level Insights**

Oobeya’s **Team Mapping** automatically associates test metrics with the right teams, allowing you to:

* Compare the quality performance between squads.
* Identify teams with higher escaped defect ratios.
* Correlate test efficiency with release stability and developer activity.

<div><figure><img src="https://docs.oobeya.io/assets/test-analytics-team-scorecard.png" alt=""><figcaption></figcaption></figure> <figure><img src="https://3582076375-files.gitbook.io/~/files/v0/b/gitbook-x-prod.appspot.com/o/spaces%2F-MGIlBSTjQtZxUoFwUx4%2Fuploads%2FJ4g9bHGXsE7tYuJP61fg%2Fimage.png?alt=media&amp;token=35e4daad-4524-4028-b34e-9e2f4f4ee9e5" alt=""><figcaption><p>Team Scorecard – Test Analytics Metrics</p></figcaption></figure></div>

***

### 5. **Turn Data into Continuous Quality Improvement**

With Oobeya Test Analytics, teams can move from intuition to evidence-based decisions:

* **Detect bottlenecks early** – Spot failing areas in UAT or automation pipelines.
* **Improve test planning** – Balance manual vs. automated testing efforts.
* **Track progress over time** – Observe how improvements impact key metrics.
* **Demonstrate ROI** – Quantify how testing contributes to better releases.

<figure><img src="https://3582076375-files.gitbook.io/~/files/v0/b/gitbook-x-prod.appspot.com/o/spaces%2F-MGIlBSTjQtZxUoFwUx4%2Fuploads%2FAOe6AeOkbGhBiPV9OVND%2Fimage.png?alt=media&amp;token=b1923c07-e087-4ca9-bd05-7bde68dad42c" alt=""><figcaption></figcaption></figure>

***

### Typical Outcomes

**Organizations using Oobeya Test Analytics achieve:**

* [x] 25–40% faster UAT cycles
* [x] Up to 30% fewer escaped defects
* [x] Clear traceability between test coverage and release quality
* [x] Standardized testing KPIs across manual and automation teams

<p align="center"><a href="https://oobeya.io/schedule-a-demo" class="button primary">See the Live Demo of Test Analytics ></a></p>


# Symptoms Catalog

Oobeya helps software development organizations identify symptoms and areas for improvement in their development and delivery processes.

### What Oobeya Offers

The Oobeya Symptoms module is a powerful tool for detecting and addressing problems in software development and delivery processes. By collecting and analyzing data from a variety of sources, the module is able to identify and alert teams to issues such as recurring anti-patterns, bad practices, and bottlenecks.

The Oobeya Symptoms module includes the following features:

* Identification of patterns and trends that may indicate problems or inefficiencies
* Alerts and recommendations for addressing detected issues

<figure><img src="https://3582076375-files.gitbook.io/~/files/v0/b/gitbook-x-prod.appspot.com/o/spaces%2F-MGIlBSTjQtZxUoFwUx4%2Fuploads%2FTE7FOZBwlA2icSzESxrP%2Fimage.png?alt=media&amp;token=21bf687a-bc10-4a4d-9f62-bc16979341f1" alt=""><figcaption><p>Oobeya Team Health and Symptoms</p></figcaption></figure>

### Benefits

The Oobeya Symptoms module can help teams improve their software development and delivery processes in the following ways:

* By identifying and addressing issues that may be causing delays or inefficiencies, teams can improve their efficiency and productivity
* By providing alerts and recommendations for addressing detected problems, the module can help teams take proactive action to prevent future issues
* By generating reports at various levels, the module can help teams understand the root causes of problems and identify areas for improvement

### Available Symptoms (more coming soon)

The Oobeya Symptoms module currently includes the following symptoms:

<table><thead><tr><th width="99.33333333333331">No #</th><th>Smyptom</th><th>Symptom Source</th></tr></thead><tbody><tr><td>S1</td><td><a href="/team-insights-and-symptoms/symptoms-catalog/s1-recurring-high-rework-rate">Recurring high rework rate</a></td><td>Gitwiser - Git Analytics (VCS tools)</td></tr><tr><td>S2</td><td><a href="/team-insights-and-symptoms/symptoms-catalog/s2-recurring-high-cognitive-load">Recurring high cognitive load</a></td><td>Gitwiser - Git Analytics (VCS tools)</td></tr><tr><td>S3</td><td><a href="/team-insights-and-symptoms/symptoms-catalog/s3-high-weekend-activity">High weekend activity</a></td><td>Gitwiser - Git Analytics (VCS tools)</td></tr><tr><td>S4</td><td><a href="/team-insights-and-symptoms/symptoms-catalog/s4-high-code-review-time">High Code Review Time</a></td><td>Gitwiser - PR Analytics (VCS tools)</td></tr><tr><td>S6</td><td><a href="/team-insights-and-symptoms/symptoms-catalog/s6-high-technical-debt-on-sonar">High technical debt on Sonar</a></td><td>Sonar</td></tr><tr><td>S7</td><td><a href="/team-insights-and-symptoms/symptoms-catalog/s7-high-vulnerabilities-on-sonar">High vulnerabilities on Sonar</a></td><td>Sonar</td></tr><tr><td>S8</td><td><a href="/team-insights-and-symptoms/symptoms-catalog/s8-high-code-quality-bugs-on-sonar">High code quality bugs on Sonar</a></td><td>Sonar</td></tr><tr><td>S9</td><td><a href="/team-insights-and-symptoms/symptoms-catalog/s9-unreviewed-pull-requests">Unreviewed Pull Requests</a></td><td>Gitwiser - PR Analytics (VCS tools)</td></tr><tr><td>S10</td><td><a href="/team-insights-and-symptoms/symptoms-catalog/s10-lightning-pull-requests">Lightning Pull Requests</a></td><td>Gitwiser - PR Analytics (VCS tools)</td></tr><tr><td>S11</td><td><a href="/team-insights-and-symptoms/symptoms-catalog/s11-oversize-pull-requests">Oversize Pull Requests</a></td><td>Gitwiser - PR Analytics (VCS tools)</td></tr><tr><td>S12</td><td><a href="/team-insights-and-symptoms/symptoms-catalog/s12-high-lead-time-for-changes-dora">High Lead Time For Changes (DORA)</a></td><td>Gitwiser - DORA Metrics (VCS + CICD + APM/IM tools)</td></tr><tr><td>S13</td><td><a href="/team-insights-and-symptoms/symptoms-catalog/s13-low-deployment-frequency-dora">Low Deployment Frequency (DORA)</a></td><td>Gitwiser - DORA Metrics (VCS + CICD + APM/IM tools)</td></tr><tr><td>S14</td><td><a href="/team-insights-and-symptoms/symptoms-catalog/s14-high-change-failure-rate-dora">High Change Failure Rate (DORA)</a></td><td>Gitwiser - DORA Metrics (VCS + CICD + APM/IM tools)</td></tr></tbody></table>

### Symptom Catalog

Each symptom includes a description, potential complications, possible causes, improvement areas, and a detection method. By identifying and addressing these symptoms, teams can improve their software development and delivery processes and achieve better outcomes.


# S1- Recurring high rework rate

This symptom refers to a high rate of coding that needs to be redone or corrected. This could be due to a lack of clear requirements, inadequate testing, or a failure to follow established processes.

### **Why is this a symptom?**

This symptom refers to a high rate of coding that needs to be redone or corrected. This could be due to a lack of clear requirements, inadequate testing, or a failure to follow established processes.&#x20;

Rework, by definition, wastes time and resources. A high rework rate is costly, time-consuming, and can cause delays, leading to frustration among team members.

{% hint style="info" %}
**Level:** Team Level

**Potential Complications:** #low\_efficiency, #slow\_delivery, #dissatisfaction
{% endhint %}

### **Possible Causes**

* Lack of clear requirements
* User stories with no clear Definition of Done
* High technical debt & complexity, low-quality code
* Lack of domain knowledge
* Lack of knowledge-sharing culture
* Inadequate testing
* Failure to follow established processes

### **Improvement Areas**

* Clarify requirements/user stories
* Improve testing processes at the development level
* Establish clear processes for analysis, development, and review
* Provide additional training as needed
* Review past instances of rework to identify patterns and root causes
* Improve knowledge-sharing culture and practices within the team

### **Detection Method**

Oobeya detects this symptom if the rework rate for recurring periods exceeds the specified threshold.

**Formula:** (churn% > \[churn\_threshold]%) x\[specified\_period] recurring periods

**Example:** During each of the **last 3 months**, the team has consistently had a **rework rate** of **more than 20%**.


# S2- Recurring high cognitive load

This symptom refers to a consistently high level of cognitive effort among team members. This could be due to a lack of resources, or a lack of knowledge-sharing culture and practices.

### **Why is this a symptom?**

This symptom refers to a consistently high level of cognitive effort among team members. This could be due to a lack of resources, or a lack of knowledge-sharing culture and practices.&#x20;

If there is a recurring high cognitive load on team members, it can be considered a symptom of the development process. A recurring high cognitive load can lead to burnout, reduced productivity, and decreased job satisfaction.

{% hint style="info" %}
**Level:** Team Level, Individual Level

**Potential Complications:** #burnout, #low\_productivity, #low\_job\_satisfaction, #knowledge\_silo
{% endhint %}

### **Possible Causes**

* Lack of resources
* Poor planning process
* Lack of knowledge-sharing culture
* Operating as a knowledge silo
* Excessive workload

### **Improvement Areas**

* Provide additional resources or support as needed
* Improve knowledge-sharing culture and practices
* Identify and break down the knowledge silos within the team
* Improve planning processes
* Ensure team members have the necessary support and resources to complete their tasks
* Review past instances of high cognitive load to identify patterns and root causes

### **Detection Method**

Oobeya detects this symptom if the impact score of an individual is significantly more than the average team impact for recurring periods.

**Formula:** (ind\_impact > 2(avg\_team\_impact)) x\[specified\_period] recurring period

**Example:** During each of the **last 3 months**, a team member has consistently had an **impact score** **2 times more than** the team average.


# S3- High weekend activity

This symptom refers to a consistently high level of activity on weekends, indicating that team members are working outside of regular work hours.

### **Why is this a symptom?**

This symptom refers to a consistently high level of activity on weekends, indicating that team members are working outside of regular work hours. This could be due to pressure to meet deadlines, an excessively demanding workload, or a lack of support from management. High weekend activity can lead to burnout, reduced productivity, and decreased job satisfaction.

If team members have coding and review activities over the weekend, it can be considered a symptom of the development process.&#x20;

{% hint style="info" %}
**Level:** Team Level

**Potential Complications:** #burnout, #low\_productivity, #low\_job\_satisfaction
{% endhint %}

### **Possible Causes**

* Lack of resources
* Pressure to meet deadlines
* Excessively demanding workload
* Lack of support from management
* Poor planning process

### **Improvement Areas**

* Review and redistribute workloads as needed
* Set clear deadlines and expectations
* Ensure team members have sufficient support and resources to complete their tasks during regular work hours
* Review past instances of high weekend activity to identify patterns and root causes

### **Detection Method**

Oobeya detects this symptom if the level of activity on weekends for the selected period exceeds the specified threshold.

**Formula:** (weekend\_commits, weekend\_PRs) > 0 in selected period

**Example:** In the past **3 months**, **more than 5 commits** and **pull request activities** were detected.


# S4 - High Code Review Time

This symptom occurs when the review time of pull requests exceeds a predefined threshold, signaling potential inefficiencies in the code review process.

### **Why is this a symptom?**

High Code Review Time is considered a symptom because it indicates potential bottlenecks and inefficiencies within the code review process, impacting the overall productivity and effectiveness of a development team. Extended code review periods may result in merging outdated or insufficiently reviewed code into the main branch, potentially leading to bugs and stability issues. Moreover, it can disrupt the rhythm of continuous integration and continuous deployment (CI/CD) practices, essential for agile and efficient software delivery.

{% hint style="info" %}
**Level:** Team Level, System Level

**Potential Complications:** #quality\_risk, #slow\_delivery, #delay\_in\_delivery, #low\_deploy\_frequency
{% endhint %}

### **Possible Causes**

* **Complex Code:** Pull requests that contain complex or large amounts of code may take longer to review thoroughly.
* **Lack of Automation:** Inadequate use of automated tools for static code analysis, testing, and style checks can increase the manual workload during reviews.
* **Insufficient Resources:** A lack of available reviewers or overburdened team members can significantly delay the review process.
* **Poor Communication:** Ineffective communication among team members can lead to misunderstandings and repeated review cycles.
* **Skill Discrepancies:** Variability in skill levels among developers and reviewers can result in slower review times, as less experienced members might require more time to understand or evaluate the code.

### **Improvement Areas**

* **Review Efficiency:** Focus on streamlining the review process through better guidelines, checklists, and pre-review preparations.
* **Automation Integration:** Implement or enhance the use of automated tools that can assist in identifying issues early and reduce the reliance on manual review.
* **Resource Allocation:** Ensure adequate allocation of human resources to handle the review workload effectively.
* **Feedback Mechanisms:** Establish robust feedback mechanisms to facilitate quick resolution of issues and continuous improvement in the review process.
* **Training and Development:** Regular training sessions and workshops to improve coding and review skills across the team.

### **Detection Method**

Oobeya detects this symptom if the number of stale pull requests for the selected period exceeds the specified threshold.

**Formula:** (number\_of\_stale\_pr) > (threshold) in the selected period

PR\_review\_time = PR\_merged - PR\_open

Stale PR: PR\_review\_time > stale\_threshold -> Stale PR detected

**Example:** In the past **6 months**, the team has merged **more than 0 stale pull requests** that have been reviewed **more than 3 days**.


# S6- High technical debt on Sonar

This symptom refers to a high level of technical debt, as reported by the static code analysis tool Sonar.

### **Why is this a symptom?**

This symptom refers to a high level of technical debt, as reported by the static code analysis tool Sonarqube/SonarCloud. Technical debt is a measure of the cost of maintaining a codebase, including the cost of fixing defects and adding new features.&#x20;

High technical debt can be an indication of poor coding practices, lack of attention to code quality, or lack of time dedicated to code maintenance.&#x20;

High technical debt can lead to increased maintenance costs, reduced code maintainability, and decreased ability to add new features in the future. It can also lead to decreased code quality, increased risk of defects and vulnerabilities, and a decrease in developer productivity.&#x20;

High technical debt can be considered a symptom of the development process, indicating that the team may need to focus on improving their coding practices, increasing time dedicated to code maintenance, and paying down the debt.

{% hint style="info" %}
**Level:** Team Level, System Level

**Potential Complications:** #quality\_risk, #low\_productivity, #slow\_delivery, #low\_developer\_satisfaction
{% endhint %}

### **Possible Causes**

* Lack of attention to code quality
* Pressure to meet deadlines
* Lack of time dedicated to code maintenance
* Use of poor coding practices
* Lack of training or knowledge on good coding practices
* Lack of established code review processes

### **Improvement Areas**

* Increase the focus on code quality
* Prioritize the reduction of technical debt
* Incorporate code review and maintenance into the development process
* Encourage collaboration and knowledge sharing on clean code
* Encourage and facilitate refactoring within the team

### **Detection Method**

Oobeya detects this symptom if the level of technical debt on Sonar for the selected period exceeds the specified threshold.

**Formula:** (sonar\_technical\_debt) > (threshold) in the selected period

**Example:** During each of the **last 3 months**, the team has consistently had **more than 180 minutes** of technical debt on Sonar.


# S7- High vulnerabilities on Sonar

This symptom refers to a high level of vulnerabilities as reported by the static code analysis tool Sonar.

### **Why is this a symptom?**

This symptom refers to a high level of vulnerabilities as reported by the static code analysis tool Sonarqube/SoanrCloud. Vulnerabilities are security weaknesses in the code that can be exploited by attackers to gain unauthorized access or control of the system.&#x20;

High vulnerabilities can be an indication of poor coding practices, lack of attention to security, or lack of time dedicated to addressing vulnerabilities. High vulnerabilities can lead to increased risk of security breaches, decreased system reliability, and decreased trust in the system. It can also lead to decreased code quality, increased risk of defects, and decreased developer productivity.&#x20;

High vulnerabilities can be considered a symptom of the development process, indicating that the team may need to focus on improving their coding practices, increasing time dedicated to addressing vulnerabilities, and paying attention to security best practices.

{% hint style="info" %}
**Level:** Team Level, System Level

**Potential Complications:** #security\_risk
{% endhint %}

### **Possible Causes**

* Lack of attention to security
* Lack of time dedicated to addressing vulnerabilities
* Use of poor secure coding practices
* Lack of training or knowledge on secure coding practices
* Lack of established security review processes

### **Improvement Areas**

* Increase the focus on security
* Prioritize the reduction of vulnerabilities
* Implement tools and processes to identify and track vulnerabilities
* Encourage collaboration and knowledge sharing on secure coding practices
* Encourage and facilitate the use of security testing tools
* Regularly review and update secure coding policies and procedures

### **Detection Method**

Oobeya detects this symptom if the level of vulnerabilities on Sonar for the selected period exceeds the specified threshold.

**Formula:** (sonar\_vulnerabilities) > (threshold) in the selected period

**Example:** The team has **more than 0** open vulnerabilities on Sonar.


# S8- High code quality bugs on Sonar

This symptom refers to a high level of code quality bugs as reported by the static code analysis tool Sonar.

### **Why is this a symptom?**

This symptom refers to a high level of code quality bugs as reported by the static code analysis tool Sonarqube/SonarCloud.&#x20;

Code quality bugs are issues in the code that can negatively impact the maintainability, performance, or functionality of the system.&#x20;

High code quality bugs can be an indication of poor coding practices, lack of attention to code quality, or lack of time dedicated to code review and maintenance.&#x20;

High code quality bugs can lead to increased maintenance costs, reduced code maintainability, and decreased ability to add new features in the future. It can also lead to decreased code quality, increased risk of defects, and decreased developer productivity.&#x20;

High code quality bugs can be considered a symptom of the development process, indicating that the team may need to focus on improving their coding practices, increasing time dedicated to code review and maintenance, and paying attention to code quality best practices.

{% hint style="info" %}
**Level:** Team Level, System Level

**Potential Complications:** #quality\_risk
{% endhint %}

### **Possible Causes**

* Lack of attention to code quality
* Lack of time dedicated to code review and maintenance
* Use of poor coding practices
* Lack of training or knowledge on good coding practices
* Lack of established code review processes

### **Improvement Areas**

* Increase the focus on code quality
* Prioritize the reduction of code-quality bugs
* Implement tools and processes to identify and track vulnerabilities
* Encourage collaboration and knowledge sharing on secure coding practices
* Encourage and facilitate automated testing

### **Detection Method**

Oobeya detects this symptom if the level of bugs on Sonar for the selected period exceeds the specified threshold.

**Formula:** (sonar\_bugs) > (threshold) in the selected period

**Example:** The team has **more than 0** open code quality bugs on Sonar.


# S9 - Unreviewed Pull Requests

This symptom refers to a high number of pull requests that have not been reviewed by other team members.

### **Why is this a symptom?**

This symptom refers to a high number of pull requests that have not been reviewed by other team members.&#x20;

Pull requests are a way for developers to submit their changes for review and merge them into the main codebase. Unreviewed pull requests can be an indication of a lack of established code review processes, lack of time dedicated to code review, or lack of team cohesion.&#x20;

Unreviewed pull requests can lead to poor-quality code being merged into the main codebase, increased risk of defects, and decreased code quality and maintainability. It can also lead to decreased developer productivity and a lack of accountability among the team.&#x20;

Unreviewed pull requests can be considered a symptom of the development process, indicating that the team may need to focus on improving their code review processes and increasing time dedicated to code review.

{% hint style="info" %}
**Level:** Team Level, System Level

**Potential Complications:** #quality\_risk
{% endhint %}

### **Possible Causes**

* Lack of established code review process
* Lack of time dedicated to code review
* Lack of team cohesion
* Lack of clear communication of the code review process
* Lack of team accountability
* The high workload on the team

### **Improvement Areas**

* Establish a clear code review process
* Prioritize code review
* Encourage collaboration and knowledge sharing
* Regularly review and update the code review process
* Encourage the team to work together
* Provide training or knowledge on the code review process

### **Detection Method**

Oobeya detects this symptom if the number of unreviewed pull requests for the selected period exceeds the specified threshold.

**Formula:** (unreviewed\_pr) > (threshold) in the selected period

**Example:** In the past **3 months**, the team has merged **more than 0** unreviewed pull requests.


# S10 - Lightning Pull Requests

This symptom refers to a high number of pull requests that are submitted and merged quickly, without adequate code review and testing.

### **Why is this a symptom?**

This symptom refers to a high number of pull requests that are submitted and merged quickly, without adequate code review and testing.&#x20;

Lightning pull requests can be an indication of a lack of established code review processes, lack of attention to code quality, or lack of team cohesion.&#x20;

Lightning pull requests can lead to poor-quality code being merged into the main codebase, increased risk of defects, and decreased code maintainability. It can also lead to decreased developer productivity and a lack of accountability among the team.&#x20;

Lightning pull requests can be considered a symptom of the development process, indicating that the team may need to focus on improving their code review processes, increasing time dedicated to review and testing, and paying attention to code quality best practices.

{% hint style="info" %}
**Level:** Team Level, System Level

**Potential Complications:** #quality\_risk
{% endhint %}

### **Possible Causes**

* Lack of established code review process
* Lack of time dedicated to code review
* High pressure to meet deadlines
* Lack of attention to code quality
* Lack of team cohesion
* Lack of clear communication of the code review process
* Lack of team accountability
* Insufficient training or knowledge on the code review process

### **Improvement Areas**

* Establish a clear code review process
* Allocate sufficient time for code review
* Encourage collaboration and knowledge sharing
* Regularly review and update the code review process
* Provide training or knowledge on the code review process

### **Detection Method**

Oobeya detects this symptom if the number of lightning pull requests for the selected period exceeds the specified threshold.

**Formula:** (lightning\_pr) > (threshold) in the selected period

**Example:** In the past **3 months**, the team has merged **more than 5 lightning pull requests** in **less than 2 minutes**.


# S11 - Oversize Pull Requests

This symptom refers to a high number of pull requests that are large in size and contain a lot of changes.

### **Why is this a symptom?**

This symptom refers to a high number of pull requests that are large in size and contain a lot of changes.&#x20;

Oversize pull requests can be an indication of a lack of established processes for breaking down large changes into smaller chunks. Oversized pull requests are more difficult to review and have more risk.

Oversized pull requests can lead to poor-quality code being merged into the main codebase, an increased risk of defects, and reviewer bottlenecks. They can also lead to decreased developer productivity, long code review times, slow delivery cycles, a reduction in code review depth, and difficulty reviewing and testing the changes.

Oversize pull requests can be considered a symptom of the development process, indicating that the team may need to focus on breaking down large changes into smaller chunks, and paying attention to code review best practices.

{% hint style="info" %}
**Level:** Team Level, System Level

**Potential Complications:** #quality\_risk, #bottleneck, #large\_deploy\_risk
{% endhint %}

### **Possible Causes**

* Lack of established processes for breaking down large changes
* Lack of experience in working in smaller chunks
* Lack of planning and estimation
* Lack of attention to code review best practices
* Insufficient training or knowledge of the code review process

### **Improvement Areas**

* Establish clear processes for breaking down large changes
* Regularly review and update the code review process (set and review an oversized PR limit)
* Provide training or knowledge on the code review process
* Improve planning and estimation skills

### **Detection Method**

Oobeya detects this symptom if the number of oversized pull requests for the selected period exceeds the specified threshold.

**Formula:** (oversize\_pr) > (threshold) in the selected period

**Example:** In the past **3 months**, the team has merged **more than 5** oversized pull requests.


# S12- High Lead Time For Changes (DORA)

This symptom refers to the significant amount of time it takes for code changes to progress from development to production.

### **Why is this a symptom?**

High Lead Time For Changes ([DORA Metrics](https://oobeya.io/dora-metrics-four-key/)) refers to the significant amount of time it takes for code changes to progress from development to production. It indicates delays and inefficiencies in the software delivery process, resulting in slower time-to-market for new features and bug fixes. This symptom is measured as part of the DORA Metrics, highlighting areas where improvements can be made in the development, testing, and deployment processes to reduce the time taken to deliver changes.

**Impact:** Delays in delivering new features, bug fixes, or improvements, leading to slower software delivery and potentially dissatisfied customers.

{% hint style="info" %}
**Level:** Team Level, System Level

**Potential Complications:** #slow\_delivery, #slow\_time\_to\_market, #poor\_customer\_satisfaction, #inefficiencies, #delay\_in\_delivery, #low\_job\_satisfaction, #low\_deploy\_frequency
{% endhint %}

### **Possible Causes**

* Inefficient code review process: Lengthy code review cycles, lack of clear guidelines or standards, and delays in providing feedback can contribute to increased lead time for changes.
* Manual and error-prone deployment processes: Reliance on manual deployment procedures, manual testing, or lack of automation in the deployment pipeline can lead to delays in releasing changes to production.
* Lack of test automation: Insufficient automated testing practices, limited test coverage, or slow and unreliable testing frameworks can prolong the time taken to validate changes.
* Technical debt and code complexity: Accumulated technical debt, including legacy code, poor architectural design, and code complexity, can make it more challenging to implement and deliver changes quickly.&#x20;
* Communication and coordination issues: Lack of effective collaboration and communication between development, QA, and operations teams can lead to delays and misalignment in the change deployment process.
* Dependencies and bottlenecks: Dependencies on external services, teams, or resources that experience delays or constraints can impact the lead time for changes.
* Inadequate infrastructure or tooling: Insufficient infrastructure resources, outdated or slow hardware, or limitations in the development or deployment tooling can contribute to longer lead times.
* Large and complex code changes - Oversize Pull Requests (Oobeya Symptom)

### **Improvement Areas**

* Streamline code review process: Implement efficient code review practices, such as smaller code review batches, clear guidelines, and timely feedback, to reduce review cycles and expedite approvals.
* Automate deployment pipelines: Invest in automated deployment pipelines to minimize manual intervention, reduce deployment bottlenecks, and speed up the delivery of changes to production.
* Optimize testing procedures: Enhance testing strategies, including automated testing frameworks, unit testing, integration testing, and performance testing, to identify and resolve issues earlier in the development cycle.
* Prioritize technical debt reduction: Allocate resources and efforts to address technical debt regularly, focusing on refactoring and code improvements to increase maintainability and agility in making changes.
* Enhance collaboration and communication: Foster strong collaboration between development, QA, and operations teams to ensure smooth coordination and minimize delays in the change deployment process.
* Implement feature toggles: Utilize feature toggles or feature flags to decouple code deployments from feature releases, enabling faster and safer delivery of changes.

### **Detection Method**

[Oobeya](https://oobeya.io/) detects this symptom if the Lead Time For Changes metric is more than the specified threshold in the selected period.

**Formula:** (lead\_time\_for\_changes) > (threshold) in the selected period

**Example:** In the past **3 months**, the Lead Time For Changes is **more than 5 days**.


# S13- Low Deployment Frequency (DORA)

This symptom refers to a situation where software changes are not deployed to production frequently. It indicates a potential bottleneck or inefficiency in the deployment process.

### **Why is this a symptom?**

Low deployment frequency (DORA) refers to a situation where software changes are not deployed to production frequently. This symptom indicates a potential bottleneck or inefficiency in the deployment process. Teams may face challenges in delivering changes to production environments, which can result in slower software delivery cycles and longer lead times for deploying new features or bug fixes.

**Impact:** Reduced agility in delivering value to users, slower feedback loops, and delayed realization of business benefits.

{% hint style="info" %}
**Level:** Team Level, System Level

**Potential Complications:** #slow\_delivery, #slow\_time\_to\_market, #poor\_customer\_satisfaction, #inefficiencies, #delay\_in\_delivery, #high\_lead\_time
{% endhint %}

### **Possible Causes**

* Inadequate resource allocation: Insufficient resources, such as limited team capacity or lack of infrastructure, can lead to delays in deploying code changes.
* Complex and lengthy deployment processes: Cumbersome and time-consuming deployment processes, involving multiple manual steps or dependencies, can hinder the frequency of deployments.
* High technical debt: Accumulated technical debt, including code that is hard to maintain or modify, can slow down the deployment process and reduce frequency.
* Limited test automation: Insufficient automated testing practices and reliance on manual testing can prolong the deployment cycle and decrease the frequency of releases.
* Ineffective release management: Poor release coordination, insufficient planning, or inadequate release management practices can result in delays and infrequent deployments.
* Lack of collaboration and communication: Inadequate collaboration and communication between teams involved in the deployment process can cause delays and reduced frequency.
* Risk-averse culture: A risk-averse culture that prioritizes stability over speed can lead to cautious deployment practices and lower deployment frequency.
* Inefficient code review and quality assurance: Lengthy or ineffective code review processes, coupled with inadequate quality assurance practices, can delay deployments and decrease frequency.

### **Improvement Areas**

* Enhancing infrastructure and resource allocation: Ensure sufficient resources are allocated to support frequent deployments, including robust infrastructure, suitable hardware, and adequate team capacity.
* Streamlining deployment processes: Identify and remove unnecessary steps, automate manual tasks, and simplify the overall deployment process to increase efficiency and speed.
* Reducing technical debt: Address technical debt by refactoring code, eliminating code smells, improving code quality, and adopting best practices to make the codebase more maintainable and deployable.
* Increasing test automation coverage: Invest in automated testing frameworks and tools to improve test coverage and reduce the time required for manual testing, enabling faster and more frequent deployments.
* Implementing effective release management practices: Develop a well-defined release management strategy that includes clear planning, coordination, and communication to enable smoother and more frequent deployments.
* Cultivating a DevOps culture: Foster a culture of collaboration, shared responsibility, and continuous improvement across development, operations, and other teams involved in the deployment process to promote a faster and more frequent release cycle.
* Prioritizing stability and reliability: Balance the need for speed with a focus on stability and reliability by implementing robust monitoring, error tracking, and incident management practices to minimize risks associated with frequent deployments.
* Optimizing code review and quality assurance: Streamline code review processes, establish clear guidelines, and ensure thorough quality assurance to expedite the review cycle and enhance the overall deployment frequency.
* Leveraging deployment automation tools: Explore and adopt deployment automation tools and technologies, such as continuous integration and continuous deployment (CI/CD) pipelines, to streamline and accelerate the deployment process.

### **Detection Method**

Oobeya detects this symptom if the Deployment Frequency metric is less than the specified threshold in the selected period.

**Formula:** (deployment\_frequency) < (threshold) in the selected period

**Example:** In the past **3 months**, the Deployment Frequency metric is **less than 0.2 days**.


# S14- High Change Failure Rate (DORA)

This symptom refers to the percentage of deployments that result in failures or incidents in production. It can lead to customer dissatisfaction, decreased user trust, and increased operational costs.

### **Why is this a symptom?**

A high change failure rate (DORA) refers to the percentage of deployments that result in failures or incidents in production. It indicates the stability and reliability of the software systems being developed and delivered. A high change failure rate can lead to customer dissatisfaction, decreased user trust, and increased operational costs.

**Impact:** Increased system instability, reduced reliability, and potential disruption to end-users or customers.

{% hint style="info" %}
**Level:** Team Level, System Level

**Potential Complications:** #quality\_risk, #low\_productivity, #poor\_customer\_satisfaction, #inefficiencies, #low\_job\_satisfaction
{% endhint %}

### **Possible Causes**

* Inadequate code review process: Insufficient attention to code quality, lack of thorough reviews, or a lack of a standardized code review process can contribute to higher failure rates.
* Insufficient testing coverage: Incomplete or inadequate testing strategies, including lack of automated testing or inadequate test coverage, can increase the likelihood of failures in production.
* High technical debt: Accumulated technical debt, such as outdated or poorly maintained code, can introduce instability and increase the likelihood of production failures.
* Lack of knowledge-sharing: Limited knowledge-sharing within the team can result in a lack of awareness about potential issues or best practices, leading to higher failure rates.
* Ineffective communication and collaboration: Poor communication and collaboration among team members can lead to misunderstandings, misaligned expectations, and ultimately, higher failure rates.

### **Improvement Areas**

* Strengthening code review practices: Implementing stricter code review processes, ensuring comprehensive reviews, and emphasizing code quality can help identify and address potential issues before they reach production.
* Enhancing testing strategies: Investing in automated testing, increasing test coverage, and implementing robust testing methodologies can improve the effectiveness of testing and reduce failures.
* Managing technical debt: Prioritizing and addressing technical debt through refactoring, code cleanup, and architectural improvements can reduce the risk of failures caused by accumulated debt.
* Promoting knowledge-sharing: Encouraging knowledge-sharing among team members through pair programming, documentation, and regular knowledge-sharing sessions can enhance understanding and awareness of potential issues.
* Fostering a culture of collaboration: Emphasizing effective communication, fostering collaboration among team members, and promoting cross-functional teamwork can improve coordination and alignment, reducing the likelihood of failures.

### **Detection Method**

Oobeya detects this symptom if the Change Failure Rate metric is more than the specified threshold in the selected period.

**Formula:** (change\_failure\_rate) > (threshold) in the selected period

**Example:** In the past **3 months**, the Change Failure Rate is **more than 20%**.


# Engineering Benchmarks

Clear, standardized benchmarks that help engineering leaders assess performance, spot risks early, and drive continuous improvement across teams.

Engineering Benchmarks define how engineering performance is evaluated, compared, and improved within Oobeya.

They provide a shared reference for **best practices**, **areas that need focus**, and **risk zones** across the software development lifecycle.

This page explains:

* How benchmarks work
* How performance levels are interpreted
* Which metrics are benchmarked, and how they are grouped.

***

### What are Engineering Benchmarks?

Engineering Benchmarks are standardized performance thresholds applied to key engineering metrics in Oobeya.

They help organizations:

* Compare teams fairly within a league
* Identify improvement opportunities early
* Create a shared language between engineering teams and leadership
* Power gamification, insights, and AI-driven recommendations

Benchmarks are designed to **highlight patterns and risks**, not to enforce rigid targets.

***

### Performance Levels

Each benchmarked metric is evaluated using **three performance levels**.

#### 🏆 Elite

* Best-in-class performance
* Healthy, scalable, and sustainable engineering practices
* Serves as a benchmark for other teams

#### ⚠️ Needs Focus

* Acceptable performance with clear improvement potential
* Early signals of inefficiency or hidden risk
* Often the highest ROI area for improvement

#### 🚨 At Risk

* Below expected performance levels
* Indicates delivery, quality, reliability, or cost risk
* Requires immediate attention

***

### Benchmark Categories

Benchmarks are grouped into the following categories:

* **Project Management**
* **Development**
* **Code Review**
* **Delivery (DORA)**
* **Code Quality**
* **Application Performance**

***

#### Project Management

<table><thead><tr><th width="331.15557861328125">Metric</th><th>Elite</th><th>Needs Focus</th><th>At Risk</th></tr></thead><tbody><tr><td>Actual Reaction Time</td><td>&#x3C; 5 days</td><td>5–10 days</td><td>> 10 days</td></tr><tr><td>Cycle Time</td><td>&#x3C; 3 days</td><td>3–10 days</td><td>> 10 days</td></tr><tr><td>Lead Time</td><td>&#x3C; 7 days</td><td>7–14 days</td><td>> 14 days</td></tr><tr><td>Productivity</td><td>> 150%</td><td>100–150%</td><td>&#x3C; 100%</td></tr><tr><td>Predictability</td><td>> 90%</td><td>70–90%</td><td>&#x3C; 70%</td></tr><tr><td>Innovation Rate</td><td>> 75%</td><td>60–75%</td><td>&#x3C; 60%</td></tr></tbody></table>

#### Development

<table><thead><tr><th width="327.9208984375">Metric</th><th>Elite</th><th>Needs Focus</th><th>At Risk</th></tr></thead><tbody><tr><td>Coding Efficiency</td><td>> 98%</td><td>90–98%</td><td>&#x3C; 90%</td></tr><tr><td>Rework Rate</td><td>&#x3C; 2%</td><td>2–10%</td><td>> 10%</td></tr><tr><td>Coding Days per Week</td><td>≥ 5 days</td><td>3–5 days</td><td>&#x3C; 3 days</td></tr></tbody></table>

#### Code Review

<table><thead><tr><th width="328.09375">Metric</th><th>Elite</th><th>Needs Focus</th><th>At Risk</th></tr></thead><tbody><tr><td>Code Review Cycle Time</td><td>&#x3C; 1 day</td><td>1–7 days</td><td>> 7 days</td></tr><tr><td>Time to Merge</td><td>&#x3C; 3 days</td><td>3–30 days</td><td>> 30 days</td></tr></tbody></table>

#### Delivery (DORA)

<table><thead><tr><th width="327.017578125">Metric</th><th>Elite</th><th>Needs Focus</th><th>At Risk</th></tr></thead><tbody><tr><td>Lead Time for Changes</td><td>&#x3C; 1 day</td><td>1–30 days</td><td>> 30 days</td></tr><tr><td>Deployment Frequency</td><td>Daily</td><td>Monthly or more</td><td>Less than monthly</td></tr><tr><td>Time to Restore Service</td><td>&#x3C; 1 day</td><td>1–30 days</td><td>> 30 days</td></tr><tr><td>Change Failure Rate</td><td>&#x3C; 15%</td><td>15–30%</td><td>> 30%</td></tr></tbody></table>

#### Code Quality

<table><thead><tr><th width="328.1072998046875">Metric</th><th>Elite</th><th>Needs Focus</th><th>At Risk</th></tr></thead><tbody><tr><td>Technical Debt (New Period)</td><td>&#x3C; 3 days</td><td>3–30 days</td><td>> 30 days</td></tr><tr><td>Test Coverage (New Period)</td><td>> 80%</td><td>60–80%</td><td>&#x3C; 60%</td></tr><tr><td>Security Severity Blocker (Overall)</td><td>0 issues</td><td>1–5 issues</td><td>> 5 issues</td></tr><tr><td>Security Severity High (Overall)</td><td>0 issues</td><td>1–5 issues</td><td>> 5 issues</td></tr><tr><td>Security Severity Blocker (New Period)</td><td>0 issues</td><td>1–5 issues</td><td>> 5 issues</td></tr><tr><td>Security Severity High (New Period)</td><td>0 issues</td><td>1–5 issues</td><td>> 5 issues</td></tr><tr><td>Security Score (Overall)</td><td>A</td><td>B–C</td><td>D–E</td></tr><tr><td>Reliability Score (Overall)</td><td>A</td><td>B–C</td><td>D–E</td></tr><tr><td>Maintainability Score (Overall)</td><td>A</td><td>B–C</td><td>D–E</td></tr></tbody></table>

#### App Performance

<table><thead><tr><th width="327.80059814453125">Metric</th><th>Elite</th><th>Needs Focus</th><th>At Risk</th></tr></thead><tbody><tr><td>APDEX Score</td><td>> 0.85</td><td>0.70–0.85</td><td>&#x3C; 0.70</td></tr><tr><td>Error Rate</td><td>&#x3C; 1%</td><td>1–5%</td><td>> 5%</td></tr><tr><td>Avg. Response Time</td><td>&#x3C; 300 ms</td><td>300–1000 ms</td><td>> 1000 ms</td></tr></tbody></table>

***

### How to Use Engineering Benchmarks

Engineering Benchmarks are most effective when used to:

* Detect risks **early**
* Guide conversations instead of enforcing targets
* Trigger insights and AI-driven recommendations.

Always interpret benchmarks in context, considering:

* Team maturity
* Product complexity
* Organizational constraints.

***

### Related Topics

* [Gamification for Engineering KPIs](/use-cases/gamification-for-engineering-kpis)
* AI Coach Insights
* [Engineering Metrics List](/getting-started/metrics)
* [Delivery & DORA Metrics](/deployment-analytics/dora-metrics-introduction)


# GitHub Copilot - AI Impact

Configuration guide for the AI Coding Assistant Impact module: GitHub Copilot data source setup, token scopes, and team scorecard mapping.

The **AI Coding Assistant Impact** module in Oobeya enables organizations to measure the adoption, engagement, and real-world impact of AI coding assistants, such as **GitHub Copilot**. By integrating with your GitHub environment, Oobeya provides visibility from **organization-level usage** down to **team-level insights**.

***

### 1. Prerequisites

Before configuring the AI Impact module:

* Ensure [**GitHub Copilot**](https://github.com/features/copilot) is enabled in your GitHub organization.
* Verify that you have admin rights to generate a **Personal Access Token (PAT)** with the required scopes.
* Network Access Requirements

  Before configuring the GitHub Copilot data source, make sure the Oobeya environment has outbound network access to the following addresses:

  * `copilot-reports.github.com`
  * `*.b01.azurefd.net`
  * `api.github.com`
  * `usagereports*.blob.core.windows.net`

  These endpoints are required for Oobeya to retrieve GitHub Copilot usage and reporting data. If access is restricted by a firewall, proxy, or allowlist policy, please allow outbound HTTPS traffic to these addresses.

***

### 2. Enable GitHub Copilot Integration

1. Navigate to **Integrations → Coding Assistant** in Oobeya.
2. Select **GitHub Copilot** and **click "Install".**

<figure><img src="https://3582076375-files.gitbook.io/~/files/v0/b/gitbook-x-prod.appspot.com/o/spaces%2F-MGIlBSTjQtZxUoFwUx4%2Fuploads%2F9xQwyDzVyU9jSBfBi4Bz%2Fimage.png?alt=media&amp;token=f6b0e1b6-f43a-43a0-8ead-5f4bfe7e1a66" alt=""><figcaption><p>GitHub Copilot Integration</p></figcaption></figure>

***

### 3. Configure Data Source

Go to Data Sources and add a **Data Source for GitHub Copilot.**

<figure><img src="https://3582076375-files.gitbook.io/~/files/v0/b/gitbook-x-prod.appspot.com/o/spaces%2F-MGIlBSTjQtZxUoFwUx4%2Fuploads%2FcUx1VZGiS7wyYwRWzand%2Fimage.png?alt=media&amp;token=28e2188f-3b2f-4011-8394-7ba21b540b8a" alt=""><figcaption><p>Adding A Data Source</p></figcaption></figure>

When adding GitHub Copilot as a data source:

* **Data Source Name:** Assign a descriptive name (e.g., *GitHub Copilot Org*).
* **API Token:** Provide a GitHub PAT with the following scopes:

#### Required Token Scopes

* `repo`
* `repo:status`
* `repo_deployment`
* `public_repo`
* `repo:invite`
* `security_event`
* `admin:org`
* `read:org`
* `manage_billing:copilot`
* `read:enterprise` *(required only for GH enterprise usage)*

Once the token is entered, click **Test Connection** → **Update** to finalize.

***

### 4. Map GitHub Copilot to Oobeya Teams

To ensure GitHub Copilot usage data flows correctly into Oobeya’s team dashboards, you need to map GitHub organizations and teams to Oobeya teams.

1. Go to **Insights → Teams**.
2. Open a **Level-2 team** that you want to configure.
3. Navigate to the **Scorecard** tab and click the **Update** button in the top-right corner.
4. Progress through the steps until you reach the **GitHub Copilot** step.
5. Select:
   * **Data Source**: Choose your GitHub Copilot data source.
   * **Organizations**: Pick the GitHub organization(s) linked with Copilot.
   * **Teams**: Map GitHub Copilot teams to the corresponding Oobeya team.

<figure><img src="https://3582076375-files.gitbook.io/~/files/v0/b/gitbook-x-prod.appspot.com/o/spaces%2F-MGIlBSTjQtZxUoFwUx4%2Fuploads%2FOb22Ss23EJ3aCiIMJrRc%2Fimage.png?alt=media&amp;token=11a1bd86-be3c-4231-925b-e147dc40f5d1" alt="Mapping GitHub Copilot Teams in Oobeya"><figcaption><p>Mapping GitHub Copilot Teams in Oobeya</p></figcaption></figure>

{% hint style="info" %}
This mapping ensures that adoption, engagement, and acceptance metrics from GitHub Copilot are correctly associated with your Oobeya team structure.
{% endhint %}

***

### 5. Viewing Results

Once configured, the AI Impact module provides analytics from the **Org level → Team level → User level**:

* **Organization-Level Metrics**
  * Overall adoption rate
  * Active vs engaged users
  * Copilot license utilization
* **Team-Level Metrics**
  * Adoption and engagement breakdown per team
  * Most active teams
  * Teams with low or no activity
  * Comparison between the actual contributions and AI contributions
* **User-Level Metrics**
  * Individual adoption and engagement
  * Suggestions accepted vs rejected
  * Inactive users in the last 7/30 days

***

### 6. Dashboard Components

* **Copilot Adoption Over Time** – Track licensed, active, and engaged users.
* **Engagement & Acceptance Trends** – Measure quality of usage (accepted vs suggested completions).
* **Usage by Language & IDE** – Identify where Copilot delivers the most value.
* **Feature Usage Insights** – Breakdown of completions, chat, and PR integrations.
* **Team & User Metrics** – Detect top users, low activity users, and training needs.
* **Comparison Between Actual Contributions and AI Contributions**

#### Learn more about the module:

{% content-ref url="/pages/evFK4r12KWr9F9k58IuL" %}
[Measuring the Impact of AI Coding Assistants](/use-cases/measuring-the-impact-of-ai-coding-assistants)
{% endcontent-ref %}

***

### 7. Troubleshooting

* **Connection Fails?**
  * Ensure token scopes are correct.
  * Verify the token is valid and not expired.
  * Ensure the required network addresses are allowlisted.
  * Verify that outbound HTTPS access is available from the Oobeya environment.
* **Data Missing for Some Teams?**
  * Confirm GitHub teams are properly mapped to Oobeya teams.
* **Low Engagement Metrics?**
  * Ensure developers have Copilot enabled in their IDEs.
  * Provide enablement sessions to improve adoption.

## **Next Steps** :dart:&#x20;

* [Network Access Requirements ](/integrations/network-access-requirements)
* [Create a new Gitwiser Analysis](/gitwiser-repo-analytics/settings-for-git-analytics/initialize-development-analytics)


# AI Cost & Credits

AI Cost & Credits helps you monitor GitHub Copilot AI Credit consumption, usage value, budget risk, and user-level cost patterns inside Oobeya AI Impact.

### What you can track

Use this page to answer:

* How many AI Credits were consumed?
* What is the gross usage value?
* How much usage is covered by included or discounted credits?
* Is there any net billable cost?
* How much of the AI Credit pool has been used?
* Which models consume the most credits?
* Which users have the highest usage?
* Are there budget risks or unusual usage patterns?

<figure><img src="https://3582076375-files.gitbook.io/~/files/v0/b/gitbook-x-prod.appspot.com/o/spaces%2F-MGIlBSTjQtZxUoFwUx4%2Fuploads%2FcM4tOVA2xS0coPaylroc%2Faicost2.png?alt=media&amp;token=9c98cc3c-45f2-4e30-8c95-31285bb6b52f" alt=""><figcaption></figcaption></figure>

***

### Accessing the page

Go to:

**AI Impact → Cost & Credits**

The page follows the same global filters as AI Impact.

<table><thead><tr><th width="245.90313720703125">Filter</th><th>Description</th></tr></thead><tbody><tr><td>Team</td><td>Filter results by all teams or a selected team</td></tr><tr><td>Type</td><td>Filter by available AI Impact type</td></tr><tr><td>Working Days</td><td>Include or exclude non-working days from calculations</td></tr><tr><td>Daily / Weekly / Monthly</td><td>Change the aggregation period</td></tr><tr><td>Date Range</td><td>Select the reporting period</td></tr></tbody></table>

***

### Summary cards

The top section gives a quick overview of AI Credit usage and cost status.

<figure><img src="https://3582076375-files.gitbook.io/~/files/v0/b/gitbook-x-prod.appspot.com/o/spaces%2F-MGIlBSTjQtZxUoFwUx4%2Fuploads%2FLHg9mTGKinLWuqBowioI%2Fimage.png?alt=media&amp;token=d82bed37-2526-4da1-8e3a-8f70f5e1a79f" alt=""><figcaption></figcaption></figure>

<table><thead><tr><th width="264.46295166015625">Card</th><th>Meaning</th></tr></thead><tbody><tr><td>Total Users</td><td>Number of users included in the selected scope</td></tr><tr><td>AI Credit Pool Value</td><td>Dollar value of the available AI Credit pool</td></tr><tr><td>Credit Pool Usage</td><td>Percentage of the available credit pool already consumed</td></tr><tr><td>Gross Usage Value</td><td>Total consumed AI Credit value before discounts or included usage</td></tr><tr><td>Discounted / Included Usage</td><td>Usage value covered by included credits or discounts</td></tr><tr><td>Net Billable Cost</td><td>Cost expected to be billed after discounts and included usage</td></tr><tr><td>Total AI Credits Used</td><td>Total AI Credits consumed in the selected period</td></tr><tr><td>Remaining Credits</td><td>Credits remaining in the available pool</td></tr><tr><td>Forecasted Month-End Usage</td><td>Estimated month-end AI Credit usage</td></tr><tr><td>Forecasted Overage</td><td>Estimated credits above the available pool</td></tr><tr><td>Avg Daily Burn Rate</td><td>Average daily AI Credit consumption</td></tr><tr><td>Cost per Active User</td><td>Gross usage value divided by active users</td></tr></tbody></table>

***

### Sections

#### 1. Summary

The Summary tab shows usage and cost trends over time.

It includes:

* Gross, included/discounted, and net billable usage trend
* Daily credit burn chart
* Latest collected report list

Use this tab to understand whether AI Credit consumption is increasing, decreasing, or spiking during the selected period.

<figure><img src="https://3582076375-files.gitbook.io/~/files/v0/b/gitbook-x-prod.appspot.com/o/spaces%2F-MGIlBSTjQtZxUoFwUx4%2Fuploads%2FWuB5Awl5hwyvWtuzB5tu%2Fimage.png?alt=media&amp;token=6864713b-9609-4d5e-9bf6-012b44056696" alt=""><figcaption></figcaption></figure>

#### 2. Pool & Forecast

The Pool & Forecast tab shows how much of the available AI Credit pool has been consumed and whether the current usage trend may create overage risk.

It includes:

<table><thead><tr><th width="270.619873046875">Metric</th><th>Description</th></tr></thead><tbody><tr><td>Total Credit Pool</td><td>Available AI Credit quota</td></tr><tr><td>Used Credits</td><td>Credits already consumed</td></tr><tr><td>Remaining Credits</td><td>Credits still available</td></tr><tr><td>Expected Usage by Today</td><td>Expected usage based on elapsed time in the period</td></tr><tr><td>Over / Under Expected</td><td>Difference between actual and expected usage</td></tr><tr><td>Projected Pool Exhaustion</td><td>Estimated date when the pool may be depleted</td></tr><tr><td>3-Day Burn Rate</td><td>Average usage based on the last 3 days</td></tr><tr><td>7-Day Burn Rate</td><td>Average usage based on the last 7 days</td></tr><tr><td>Forecasted Month-End Usage</td><td>Projected total usage by the end of the month</td></tr></tbody></table>

Use this tab to identify whether the organization is on track, under-consuming, or likely to exceed the available pool.

<figure><img src="https://3582076375-files.gitbook.io/~/files/v0/b/gitbook-x-prod.appspot.com/o/spaces%2F-MGIlBSTjQtZxUoFwUx4%2Fuploads%2FXdFjK5vP01TL5fx6BfIj%2Fimage.png?alt=media&amp;token=f3f8fee1-4d22-46c0-b1af-a09f5a1192cc" alt=""><figcaption></figcaption></figure>

#### 3. Models

The Models tab breaks down AI Credit consumption by model.

It includes:

* Credit share by model
* Cost by model table
* Gross, discount, and net values per model
* User count per model
* Auto-selected model labels where available

Use this tab to identify which models are responsible for most AI Credit consumption.

<figure><img src="https://3582076375-files.gitbook.io/~/files/v0/b/gitbook-x-prod.appspot.com/o/spaces%2F-MGIlBSTjQtZxUoFwUx4%2Fuploads%2FXN45PImexxTJBnl6SXvZ%2Fimage.png?alt=media&amp;token=fc883392-67ed-42f4-8e60-ac0d3d582730" alt=""><figcaption></figcaption></figure>

Typical questions:

* Which model consumes the most credits?
* Are premium models driving most of the cost?
* How much usage comes from auto-selected models?
* Which models should be reviewed for optimization?

#### 4. Users

The Users tab shows user-level AI Credit consumption.

It includes:

<table><thead><tr><th width="258.610107421875">Column</th><th>Description</th></tr></thead><tbody><tr><td>User</td><td>GitHub / mapped Oobeya user</td></tr><tr><td>Credits Used</td><td>Total AI Credits consumed by the user</td></tr><tr><td>Gross Value</td><td>Consumed credit value</td></tr><tr><td>Discounted Value</td><td>Value covered by included/discounted usage</td></tr><tr><td>Net Billable Cost</td><td>Billable cost after discounts</td></tr><tr><td>Pool Impact</td><td>User share of total credit usage</td></tr><tr><td>Primary Model</td><td>Most-used model by the user</td></tr><tr><td>Models Used</td><td>Number of different models used</td></tr><tr><td>Daily Burn Rate</td><td>Average daily usage</td></tr><tr><td>Projected Month-End Credit</td><td>Estimated month-end usage</td></tr><tr><td>Status</td><td>Usage status such as Risk or Critical</td></tr></tbody></table>

Click a user to open the detail drawer.

The user detail drawer shows:

* Credits used
* Gross value
* Net billable cost
* Daily burn rate
* Projected month-end credits
* Status
* AI Credit usage timeline
* Model breakdown

{% hint style="info" %}
User-level data should be interpreted as usage visibility, not individual performance evaluation.
{% endhint %}

#### 5. Budget Recommendations

The Budget Recommendations tab provides soft budget recommendations based on current and forecasted usage.

It includes:

<table><thead><tr><th width="280.41436767578125">Column</th><th>Description</th></tr></thead><tbody><tr><td>User</td><td>User receiving the recommendation</td></tr><tr><td>Current Budget</td><td>Current assigned AI Credit budget</td></tr><tr><td>Credits Used</td><td>Credits already consumed</td></tr><tr><td>Remaining Budget</td><td>Remaining budget amount</td></tr><tr><td>Forecasted Month-End Usage</td><td>Estimated end-of-month usage</td></tr><tr><td>Projected Increase</td><td>Expected increase above current budget</td></tr><tr><td>Recommended New Budget</td><td>Suggested adjusted budget</td></tr><tr><td>Priority</td><td>Recommendation priority</td></tr><tr><td>Reason</td><td>Explanation of the recommendation</td></tr><tr><td>Status</td><td>Current recommendation status</td></tr></tbody></table>

Budget recommendations are advisory. They help teams review usage patterns and capacity needs.

#### 6. Risks & Insights

The Risks & Insights tab highlights important usage and budget signals.

Examples include:

* Credit pool exhaustion risk
* Usage fully covered by included credits
* Users with critical usage patterns
* High-cost model concentration
* Forecasted overage risk

Risk levels may include:

* Info, Low, Medium, High, Critical

<figure><img src="https://3582076375-files.gitbook.io/~/files/v0/b/gitbook-x-prod.appspot.com/o/spaces%2F-MGIlBSTjQtZxUoFwUx4%2Fuploads%2FErmL2oq2rzODEh0Q2ehP%2Fimage.png?alt=media&amp;token=68a728bb-7552-4d18-842c-1032bd703f43" alt=""><figcaption></figcaption></figure>

Use this section to quickly identify items that may require review.

#### 7.  Raw Report

The Raw Report tab displays the collected GitHub AI usage report rows.

Use this tab when you need to inspect the source-level report data behind the dashboards.

***

### Key definitions

<table><thead><tr><th width="277.8829345703125">Term</th><th>Definition</th></tr></thead><tbody><tr><td>AI Credits</td><td>Usage unit used to measure GitHub Copilot AI consumption</td></tr><tr><td>Gross Usage Value</td><td>Dollar value of consumed AI Credits before discounts</td></tr><tr><td>Discounted / Included Usage</td><td>Usage value covered by included credits or discounts</td></tr><tr><td>Net Billable Cost</td><td>Remaining cost after included usage and discounts</td></tr><tr><td>Credit Pool</td><td>Available AI Credit quota for the selected period</td></tr><tr><td>Burn Rate</td><td>Average AI Credit consumption over time</td></tr><tr><td>Forecasted Overage</td><td>Estimated usage above the available credit pool</td></tr></tbody></table>

***

### Recommended workflow

1. Start with **Summary** to understand the overall trend.
2. Open **Pool & Forecast** to check pool usage and overage risk.
3. Review **Models** to identify high-consumption models.
4. Review **Users** to understand user-level usage patterns.
5. Check **Budget Recommendations** for projected capacity needs.
6. Use **Risks & Insights** to focus on items needing attention.
7. Use **Raw Report** only when you need source-level details.


# Resource Allocation (Kaynak Tahsisi)

Oobeya’nın **Resource Allocation** modülü, takımların iş yüklerini ve proje dağılımlarını analiz ederek daha verimli bir kaynak yönetimi sağlar. Takımların kapasiteleri, görev yükleri ve proje öncelikleri doğrultusunda dengeli şekilde çalışmasını destekler.

Bu modül, yöneticilerin&#x20;

* Takım kapasitelerini görselleştirmesine,&#x20;
* **Aşırı** **veya** **yetersiz** **yüklenen** takımları ve takım üyelerini tespit etmesine,
* **Kaynak planlamasını daha sağlıklı yapmasına** yardımcı olur.

<figure><img src="https://3582076375-files.gitbook.io/~/files/v0/b/gitbook-x-prod.appspot.com/o/spaces%2F-MGIlBSTjQtZxUoFwUx4%2Fuploads%2FCUkEIJHKY0630CDvJNl9%2FScreenshot%202025-07-31%20at%2014.25.10.png?alt=media&amp;token=e6ed5831-e348-4768-ba46-95f1c34e59b1" alt=""><figcaption><p>Resource Allocations Module</p></figcaption></figure>

***

### Önkoşullar

Resource Allocation modülünü kullanmadan önce aşağıdaki şartların sağlandığından emin olun:

* [x] **Proje yönetim aracı entegrasyonu aktif durumda olmalı:**\
  Bu modül, Jira veya Azure Boards gibi proje yönetim araçlarına bağlanarak verileri Oobeya'nın AgileSpace modülü üzerinden çeker.&#x20;
* [x] **Projeler AgileSpace üzerinde analiz edilmiş olmalı:**\
  Jira veya Azure Boards projelerinizin AgileSpace modülünde aktif olarak analiz edildiğinden emin olun.
* [x] **Contributors profilleri oluşturulmuş olmalı:**\
  Proje teslimat sürecine dahil olan her kullanıcının Oobeya'da bir katkıcı (contributor) profili olmalıdır.
* [x] **Hesaplar birleştirilmiş (gerekiyorsa) olmalı:**\
  Jira/Azure Boards üzerindeki mükerrer kullanıcı hesapları birleştirilmelidir. Aksi halde hesaplamalarda eksiklikler oluşabilir.
* [x] **Kapsama dahil edilmiş roller seçilmiş olmalı:**\
  Sadece belirli roller (örn. Developer) hesaplamalara dahil edilir. Rolleri `Administration > Resource Allocations` menüsünden yönetebilirsiniz. Detaylar [aşağıda](#admin-ayarlari) açıklanmıştır.
* [x] **Gereksiz iş öğesi tipleri hariç tutulmuş olmalı:**\
  Analizin doğruluğunu artırmak için gereksiz iş öğesi tiplerini (örn. soru, yorum) analiz kapsamından hariç turtmak amacıyla `Administration > AgileSpace > Work Item Type Exclusion` bölümünden filtreleme yapabilirsiniz.

***

### Temel Kavramlar

* **Kaynak (Resource)**: Geliştirme süreçlerinde görev alan kişi (örn. yazılım geliştirici, QA, analist).
* **Proje (Project)**: Üzerinde çalışılan işin veya ürünün tanımıdır. Jira ve Azure Boards entegrasyonu ile çalışmaktadır.
* **Dağılım (Tahsis) Oranı (Project Allocation %)**: Bir kaynağın (kişinin) belirli bir projeye tahsis edilmiş efor veya görev (work item) oranını ifade eder.
* **Kaynak Kullanım Oranı (Resource Utilization %)**: Kaynağın tahsis edildiği işin ne kadarını teslim edebildiğini gösterir.

***

### Nasıl Çalışır?

**Genel Bakış (Overview)**

Modül, kurum genelinde veya belirli bir organizasyon birimi için özet bilgiler sunar:

* **Toplam Proje Sayısı** (Total Projects)
* **Toplam Kaynak Sayısı** (Total Resources)
* **Effort Bazlı Kullanım (%)** (Utilization by Effort)
* **İş Sayısına Göre Kullanım (%)** (Utilization by Count)
* **Kaynak Durumu Dağılımı** (Resource Status chart)

Her iki kullanım metriği de **iş yükü dengesizliğini** veya **düşük verimliliği** görsel olarak ortaya koyar.

***

### **1. Kaynak Kullanım Oranı (Utilization %) Hesaplaması**

Kaynak kullanım oranı, bir takımın ve takım üyelerinin planlanan iş yükünün mevcut teslimat kapasitesine göre ne kadar dolu olduğunu gösterir. Şu durumları analiz etmenizi sağlar:

* Takım ve takım üyeleri **az yüklü** mü?
* Takım ve takım üyeleri **ideal seviyede** mi çalışıyor?
* Takım ve takım üyeleri **aşırı mı yüklenmiş?**

#### Formül:

```
Kullanım Oranı (%) = (Planlanan İş Sayısı / Takım Ortalama Kapasitesi) × 100
```

**Takım Ortalama Kapasitesi** ise şu şekilde hesaplanır:

```
Takım Ortalama Kapasitesi = Teslim Edilen İş Sayısı / Katılımcı Sayısı
```

#### Örnek:

* Takım tarafından toplam teslim edilen (delivered) iş miktarı: 100
* Takım üyesi sayısı: 5
* Bir kaynak (örn. Dev-A) için planlanan iş miktarı: 25

→ Takım Ortalama Kapasite = 100 / 5 = 20\
→ Dev-A Kaynak Kullanım Oranı (Utilizaiton) = (25 / 20) × 100 = **%125**

#### Değerlendirme:

| Kullanım Oranı % (default değerler) | Durum                                       |
| ----------------------------------- | ------------------------------------------- |
| ≤ %85                               | Az Yüklenmiş (Underutilized)                |
| %85 – %110                          | İdeal Kullanım (Optimally Utilized)         |
| %110 – %130                         | Hafif Aşırı Yüklenmiş (Slightly Overloaded) |
| > %130                              | Aşırı Yüklenmiş (Overloaded)                |

{% hint style="info" %}
Bu varsayılar eşik değerler, `Administration > Resource Allocations` menüsünden özelleştirilebilir.
{% endhint %}

<figure><img src="https://3582076375-files.gitbook.io/~/files/v0/b/gitbook-x-prod.appspot.com/o/spaces%2F-MGIlBSTjQtZxUoFwUx4%2Fuploads%2F3r0TB3AGR9HFPAxoL6t8%2Fimage.png?alt=media&amp;token=62870473-afab-41ee-94ef-b0725e2905c1" alt=""><figcaption><p>Resource Status</p></figcaption></figure>

***

### 2. Proje Tahsis Oranı (Project Allocation %) **Hesaplaması**

Proje tahsis oranı, bir takım üyesinin (kaynağın) zamanının ve eforunun ne kadarının belirli bir projeye ayrıldığını gösterir.&#x20;

Özellikle birden fazla projede çalışan kişilerin izlenebilmesi için faydalıdır.

<figure><img src="https://3582076375-files.gitbook.io/~/files/v0/b/gitbook-x-prod.appspot.com/o/spaces%2F-MGIlBSTjQtZxUoFwUx4%2Fuploads%2FwgVUIve0jogp3Hj9lVrm%2Fimage.png?alt=media&amp;token=708b2c90-1d1a-409e-ab6a-e2d3474758e5" alt=""><figcaption><p>Project Allocation</p></figcaption></figure>

#### Formül:

```
Proje Tahsis Oranı (%) =
(Kişinin Bu Projede Planlanan İş Sayısı / Tüm Projelerde Planlanan Toplam İş Sayısı) × 100
```

#### Örnek:

* Ayşe’nin Proje A’daki planlanan iş miktarı: 5
* Ayşe’nin tüm projelerdeki toplam planlanan iş miktarı: 10

→ Proje Dağılımı = (5 / 10) × 100 = **%50**

Bu, Ayşe’nin zamanının %50’sini Proje A’ya ayırdığı anlamına gelir.

***

### Ek Bilgiler

* Veriler AgileSpace (Oobeya’nın Agile analiz modülü) üzerinden alınır.
* Sadece seçili roller (örn. Developer) hesaplamalara dahil edilir. Bu roller `Administration > Resource Allocations` üzerinden düzenlenebilir.
* Modülde **İş Sayısı (Item Count)** ve **Effort (story points ya da süre tahmini)** arasında geçiş yapılabilir.
* Doğru analiz sonuçları için Oobeya'da kullanıcı profilleri (contributor profile) oluşturulmalı ve gerekiyor ise hesap birleştirme (account merge) işlemleri tamamlanmalıdır.

***

### Admin Ayarları

Oobeya, kaynak kullanım raporlarını esnek biçimde yapılandırabilmeniz için yöneticilere özel ayarlar sunar. Bu ayarlar sayesinde “kullanım durumlarının” nasıl kategorize edileceğini belirleyebilir ve belirli rollerin hesaplamalara dahil edilip edilmeyeceğini yönetebilirsiniz.

***

#### 1. Resource Allocation Thresholds (Eşik Değer Ayarları)

Bu eşik değerleri, kaynakların hangi oranlarda **yetersiz kullanılmış**, **optimal**, **hafif aşırı yüklenmiş** ya da **aşırı yüklenmiş** olarak sınıflandırılacağını tanımlar:

| Kategori                | Açıklama                                                                                            | Varsayılan (%) |
| ----------------------- | --------------------------------------------------------------------------------------------------- | -------------- |
| **Underutilized**       | Kaynak kullanım oranı bu değerin altında ise “yetersiz kullanılıyor” kabul edilir.                  | 85             |
| **Optimally Utilized**  | Bu değer aralığında kalan kaynaklar “optimum kullanılıyor” olarak işaretlenir.                      | 110            |
| **Slightly Overloaded** | Bu sınırın üzerindeki ancak aşırı yüklenmemiş kaynaklar “hafif aşırı yüklü” olarak sınıflandırılır. | 130            |
| **Overloaded**          | %130’dan daha yüksek oranlar “aşırı yüklenmiş” olarak kabul edilir.                                 | >130           |

> Her bir eşik değerinin yanında bulunan (i) ikonları, kullanıcıya kısa açıklamalar sunmak için bilgilendirici ipuçları içerir.

* **Reset**: Varsayılan değerlere geri döner.
* **Save**: Yapılan değişiklikleri kalıcı olarak kaydeder.

***

#### 2. Allocation Roles (Rol Bazlı Hariç Tutma)

Bu ayar, hangi kullanıcı rollerinin Resource Allocation modülünde **analize dahil edileceğini** belirlemenizi sağlar.

* Örneğin: Sadece `Developer` rolü seçiliyse, yalnızca bu role sahip kullanıcıların iş yükü ve kapasite verileri değerlendirmeye alınır.
* Böylece analiz dışı bırakılması gereken roller (örneğin: QA, analist, yönetici, destek vb.) kapsam dışı kalır.

**Kullanım Senaryosu:**\
Bir proje yöneticisi, yalnızca yazılımcıların verimini ölçmek istiyorsa, `Developer` rolü dışındaki katkıları hariç tutarak daha anlamlı sonuçlar elde edebilir.

{% hint style="info" %}
Bu ayar tüm organizasyonu etkiler ve yalnızca **yönetici yetkisine sahip** kullanıcılar tarafından değiştirilebilir.
{% endhint %}


# Resource Allocation

The **Resource Allocation** module in Oobeya enables teams to analyze workload distribution and project allocations, supporting more efficient resource management. It helps ensure that teams work in a balanced way based on their capacity, task load, and project priorities.

With this module, engineering leaders can:

* Visualize team capacities,
* Identify **overloaded** or **underutilized** teams and contributors,
* Improve **resource planning** based on real-time data.

<figure><img src="https://3582076375-files.gitbook.io/~/files/v0/b/gitbook-x-prod.appspot.com/o/spaces%2F-MGIlBSTjQtZxUoFwUx4%2Fuploads%2FCUkEIJHKY0630CDvJNl9%2FScreenshot%202025-07-31%20at%2014.25.10.png?alt=media&#x26;token=e6ed5831-e348-4768-ba46-95f1c34e59b1" alt=""><figcaption><p>Resource Allocations Module</p></figcaption></figure>

***

### Prerequisites

Before using the Resource Allocation module, make sure the following conditions are met:

* [x] **Project Management tool integration is active**: The module pulls data from the project management tools like Jira or Azure Boards via Oobeya's AgileSpace module.
* [x] **Projects are analyzed on AgileSpace**: Ensure your Jira or Azure Boards projects are being actively analyzed in AgileSpace.
* [x] **Contributor Profiles are created**: Every contributor involved in project delivery work must have a contributor profile in Oobeya.
* [x] **Accounts are merged (if needed)**: Duplicate Jira/Azure Boards accounts should be merged to avoid miscalculations.
* [x] **Relevant roles are configured**: Only selected roles (e.g., Developer) are included in allocation calculations. Roles can be managed via `Administration > Resource Allocations`. [See the details below](#admin-settings).
* [x] **Exclude unnecessary work item types**: Go to  `Administration > AgileSpace > Work Item Type Exclusion` to exclude irrelevant work item types (e.g., questions, comments) from the analysis to improve accuracy.

***

### Key Concepts

* **Resource**: A contributor involved in the development process (e.g., developer, QA, analyst).
* **Project**: The initiative or product being worked on. The module integrates with Jira and Azure Boards.
* **Project Allocation %**: Represents the ratio of effort or tasks a contributor is assigned to a specific project.
* **Resource Utilization %**: Indicates how much of the assigned work a resource was able to deliver.

***

### How It Works

**Overview Panel**

The module provides a summary across the entire organization or selected units:

* **Total Projects**
* **Total Resources**
* **Utilization by Effort (%)**
* **Utilization by Count (%)**
* **Resource Status Chart**

Both utilization metrics help visually identify **workload imbalances** or **inefficient use of capacity**.

***

### **1. Resource Utilization (%) Calculation**

Resource utilization indicates how full a team or individual is compared to their actual delivery capacity. It helps you evaluate:

* Are teams or individuals **underloaded**?
* Are they operating at an **optimal level**?
* Are they **overloaded**?

**Formula:**

```
Utilization (%) = (Planned Work Items / Team Average Capacity) × 100
```

**Team Average Capacity** is calculated as:

```
Team Average Capacity = Delivered Work Items / Number of Contributors
```

**Example:**

* Total Delivered Work Items: 100
* Team Members: 5
* Planned Work Items for Dev-A: 25

→ Team Avg Capacity = 100 / 5 = 20\
→ Dev-A’s Utilization = (25 / 20) × 100 = **125%**

**Interpretation:**

| Utilization % (default) | Status              |
| ----------------------- | ------------------- |
| ≤ 85%                   | Underutilized       |
| 85% – 110%              | Optimally Utilized  |
| 110% – 130%             | Slightly Overloaded |
| > 130%                  | Overloaded          |

{% hint style="info" %}
These default thresholds can be customized via `Administration > Resource Allocations`.
{% endhint %}

<figure><img src="https://3582076375-files.gitbook.io/~/files/v0/b/gitbook-x-prod.appspot.com/o/spaces%2F-MGIlBSTjQtZxUoFwUx4%2Fuploads%2F3r0TB3AGR9HFPAxoL6t8%2Fimage.png?alt=media&#x26;token=62870473-afab-41ee-94ef-b0725e2905c1" alt=""><figcaption><p>Resource Status</p></figcaption></figure>

***

### 2. Project Allocation (%) Calculation

Project allocation indicates how much of a contributor’s time and effort is assigned to a particular project.

This is especially helpful for tracking contributors working on multiple projects simultaneously.

<figure><img src="https://3582076375-files.gitbook.io/~/files/v0/b/gitbook-x-prod.appspot.com/o/spaces%2F-MGIlBSTjQtZxUoFwUx4%2Fuploads%2FwgVUIve0jogp3Hj9lVrm%2Fimage.png?alt=media&#x26;token=708b2c90-1d1a-409e-ab6a-e2d3474758e5" alt=""><figcaption><p>Project Allocation</p></figcaption></figure>

**Formula:**

```
Project Allocation (%) =
(Planned Items for This Project by Person / Total Planned Items by Person Across All Projects) × 100
```

**Example:**

* Planned Tasks for Jane in Project A: 5
* Total Planned Tasks for Jane Across All Projects: 10

→ Project Allocation = (5 / 10) × 100 = **50%**

This means 50% of Jane's effort is allocated to Project A.

***

### Additional Notes

* Data is retrieved from AgileSpace (Oobeya’s Agile analytics module).
* Only selected roles (e.g., Developer) are included in calculations. Manage role settings via `Administration > Resource Allocations`.
* The module supports toggling between **Item Count** and **Effort** (story points or time estimates).
* For accurate results, ensure contributor profiles are created in Oobeya and merged if necessary.

***

### Admin Settings

Oobeya provides configuration options for administrators to tailor the module’s behavior, such as defining resource status thresholds and selecting which roles are included in the analysis.

***

#### **1. Resource Allocation Thresholds**

These thresholds define how resource utilization is classified:

| Category                | Description                                              | Default (%) |
| ----------------------- | -------------------------------------------------------- | ----------- |
| **Underutilized**       | Below this rate, resources are considered underutilized. | 85          |
| **Optimally Utilized**  | Within this range, resources are considered balanced.    | 110         |
| **Slightly Overloaded** | Between optimal and heavily overloaded.                  | 130         |
| **Overloaded**          | Above this rate, resources are marked as overloaded.     | >130        |

> Each threshold is explained via tooltip icons next to the fields.

* **Reset**: Reverts to default values.
* **Save**: Saves your custom threshold settings.

***

#### **2. Allocation Roles (Role-Based Exclusions)**

This setting lets you control which contributor roles are included in Resource Allocation analytics.

* For example: If only the `Developer` role is selected, only those contributors’ workloads are analyzed.
* This excludes non-engineering roles such as QA, Analyst, Management, Support, etc.

**Use Case:**\
If a project manager wants to evaluate only developer productivity, excluding other roles results in more meaningful insights.

{% hint style="info" %}
This setting affects the entire organization and can only be modified by users with admin privileges.
{% endhint %}


# Gamification (Oyunlaştırma)

Oobeya’nın **Gamification** modülü, mühendislik ekiplerinin performansını artırmak için puan tabanlı rekabetçi bir yapı sunar. Takımların ilerlemelerini görselleştirir, motivasyonu artırır ve başarıları görünür kılar. Bu özellik ile ligler oluşturabilir, performans metriklerini tanımlayabilir, takımlar arasında puanları karşılaştırabilir ve yüksek performansı ödüllendirebilirsiniz.

<figure><img src="https://3582076375-files.gitbook.io/~/files/v0/b/gitbook-x-prod.appspot.com/o/spaces%2F-MGIlBSTjQtZxUoFwUx4%2Fuploads%2FHxqtl9kUbZoescNlLyHO%2Fimage.png?alt=media&amp;token=82ae69cf-b735-4068-9a28-2a236f56b75c" alt="Oobeya Gamification Module"><figcaption><p>Oobeya Gamification Module</p></figcaption></figure>

***

### 📌 Temel Kavramlar

* **League (Lig)**: Takımların performans metriklerine göre puan topladığı yarışma yapısıdır.
* **Round (Tur)**: Belirli aralıklarla puan hesaplamalarının yapıldığı dönemlerdir (örn. haftalık, iki haftalık ve aylık).
* **Referees (Hakemler)**: Otomatik hesaplamalara ek olarak manuel puanlamayı denetleyen, sonuçları güncelleme ve onaylama hakkına sahip kullanıcılardır.
* **Points (Puanlar)**: Belirlenen eşik değerlerine göre takımlara otomatik veya manuel olarak verilen sayısal değerlerdir.

***

### ⚙️ Nasıl Çalışır?

<figure><img src="https://3582076375-files.gitbook.io/~/files/v0/b/gitbook-x-prod.appspot.com/o/spaces%2F-MGIlBSTjQtZxUoFwUx4%2Fuploads%2FPUVqWnP8mIFmBdiHB45D%2Fimage.png?alt=media&amp;token=62c7cae1-2ed7-4c9f-8b90-a178eaca0906" alt=""><figcaption><p>Create New League - step by step</p></figcaption></figure>

#### 1. Lig Oluşturma (League Setup)

**Gamification > Leagues Management > New League** adımından yeni bir lig oluşturabilirsiniz.

Gerekli alanlar:

* **Lig Adı** ve **Açıklama**
* **Hakemler**: En az 1, en fazla 5 kullanıcı seçilmelidir.
* **Puanlama Aralığı**: Haftalık, iki haftalık, aylık
* **Başlangıç / Bitiş Tarihi** *(isteğe bağlı)*
* **Lig Logosu** *(isteğe bağlı)*

> ⚠️ Bitiş tarihi girilirse, başlangıç tarihinden en az 28 gün sonra ve en fazla 365 gün içinde olmalıdır. Bitiş tarihi boş bırakılırsa lig süresiz olarak devam eder.

***

#### 2. Metrik Seçimi (Metric Selection)

<figure><img src="https://3582076375-files.gitbook.io/~/files/v0/b/gitbook-x-prod.appspot.com/o/spaces%2F-MGIlBSTjQtZxUoFwUx4%2Fuploads%2F6EQqYHGXqfsgctae262d%2Fimage.png?alt=media&amp;token=4efa50ec-d3c9-42d4-baef-38980b19f421" alt=""><figcaption><p>Metric Selection</p></figcaption></figure>

Lig kapsamında puanlanacak performans metriklerini seçin. Kategoriler:

* **Proje Yönetimi** (Örn. Lead Time, Predictability)
* **Geliştirme** (Örn. Rework Rate, Coding Efficiency)
* **Kod İnceleme**
* **Kod Kalitesi**
* **Güvenlik**
* **Semptomlar**

> Bu adımda seçilen metrikler, **otomatik puanlama** için kullanılacaktır.

***

#### 3. KPI Puanlama (KPI Scoring)

<figure><img src="https://3582076375-files.gitbook.io/~/files/v0/b/gitbook-x-prod.appspot.com/o/spaces%2F-MGIlBSTjQtZxUoFwUx4%2Fuploads%2FQWGkELzEHWKpi2OU0HuL%2Fimage.png?alt=media&amp;token=fd5d44fc-d66f-4a51-b38e-ce920dce41ab" alt=""><figcaption><p>KPI Scoring</p></figcaption></figure>

Her metrik için puanlama eşikleri tanımlayın. Örnek:

* Cycle Time < 3 gün → 3 puan
* 3–10 gün arası → 1 puan
* 10 gün → 0 puan

> Eşiklerin mantıksal tutarlılığı kullanıcı sorumluluğundadır.

***

#### 4. Manuel KPI'lar (İsteğe Bağlı) (Manual KPIs)

<figure><img src="https://3582076375-files.gitbook.io/~/files/v0/b/gitbook-x-prod.appspot.com/o/spaces%2F-MGIlBSTjQtZxUoFwUx4%2Fuploads%2F8qvsP4jiFxrZ43w8P2XP%2Fimage.png?alt=media&amp;token=e2fc62eb-b679-4948-9ad0-a170f3b72cd0" alt=""><figcaption><p>Manual KPIs</p></figcaption></figure>

Manuel olarak hakemler tarafından puanlanacak özel KPI’ları tanımlayın.

Her KPI için:

* Etiket (Ad)
* Açıklama
* Maksimum Puan

***

#### 5. Takım Seçimi (Team Selection)

<figure><img src="https://3582076375-files.gitbook.io/~/files/v0/b/gitbook-x-prod.appspot.com/o/spaces%2F-MGIlBSTjQtZxUoFwUx4%2Fuploads%2FGQhq7q6JE4ArZKPVXDU1%2Fimage.png?alt=media&amp;token=a13da56d-8eb4-4abc-8a3e-46dca80374b1" alt=""><figcaption><p>Team Selection</p></figcaption></figure>

Lige dahil olacak takımları belirleyin. Sadece ilgili metriklerde verisi olan takımlar seçilmelidir.

***

#### 6. Son Kontrol ve Başlatma (Final Review)

Tüm ayarları gözden geçirin ve **Lig Oluştur** butonu ile süreci başlatın.

***

### 🔄 Round (Tur) Yönetimi

Her lig, seçilen zaman aralığında otomatik olarak bir tur **(round)** oluşturur.

Round'lar o ligin hakemleri tarafından yönetilebilir **--> League Management > Manage Rounds**

<figure><img src="https://3582076375-files.gitbook.io/~/files/v0/b/gitbook-x-prod.appspot.com/o/spaces%2F-MGIlBSTjQtZxUoFwUx4%2Fuploads%2FmS5vgiEwenaAFnkiqdM5%2Fimage.png?alt=media&amp;token=caad7134-81c2-481a-9514-162670fc7dcf" alt=""><figcaption><p>Manage Rounds</p></figcaption></figure>

#### Round Özellikleri:

<figure><img src="https://3582076375-files.gitbook.io/~/files/v0/b/gitbook-x-prod.appspot.com/o/spaces%2F-MGIlBSTjQtZxUoFwUx4%2Fuploads%2FbXzMiU36AnTvTitQouek%2Fimage.png?alt=media&amp;token=d076476f-bd62-40ef-b23a-7a6710ff08f5" alt=""><figcaption></figcaption></figure>

* **Hesaplama Tarihi (Round Date)**: Puanların hesaplandığı tarihtir.
* **Round Durumları (State)**:
  * `Sonraki Tur İçin Planlandı (Scheduled for the next round)`
  * `İşleniyor (In Progress)`
  * `Onay Bekliyor (Pending Approval)`
  * `Onaylandı (Approved)`
  * `Hata (Failed)`
  * `İptal Edildi (Cancelled)`

Hakemler, tur puanlarını **inceleyip onaylayabilir** veya gerekirse düzenleme yapabilir.

***

### ✏️ Puan Güncelleme (Update Scores)

<figure><img src="https://3582076375-files.gitbook.io/~/files/v0/b/gitbook-x-prod.appspot.com/o/spaces%2F-MGIlBSTjQtZxUoFwUx4%2Fuploads%2F4YW842xAinNry9mS3pDX%2Fimage.png?alt=media&amp;token=0ad3bb66-c443-4dc2-a482-b7fb9d958724" alt=""><figcaption><p>Update Scores for a round</p></figcaption></figure>

Her KPI için hakemler:

* Gerçekleşen metrik değerini görebilir. (Value)
* Otomatik hesaplanan puanı kontrol edebilir. (Calculated Score)
* Gerekirse puanı manuel olarak düzenleyebilir. (Update)
* “Onayla” butonu ile puanı sabitleyebilir.&#x20;

> Tüm otomatik puanlar tekrar sağ üstte yer alan **Yeniden Hesapla (Recalculate)** butonu ile güncellenebilir.

***

### 📊 Lider Tablosu (Leaderboard)

<figure><img src="https://3582076375-files.gitbook.io/~/files/v0/b/gitbook-x-prod.appspot.com/o/spaces%2F-MGIlBSTjQtZxUoFwUx4%2Fuploads%2FEpKnYL0ahYogJXgWG8Cb%2Fimage.png?alt=media&amp;token=1500f60a-2af6-45e8-ad9b-f622e41a2579" alt=""><figcaption><p>Leaderboard</p></figcaption></figure>

Lider tablosu, takımların toplam puanlarına göre sıralamasını gösterir:

* Zaman içindeki ilerlemeyi izleyin.
* Geçmiş turlara dönük detaylara ulaşın.
* Hangi takımın hangi metrikten puan kazandığını görün.

***

### 🔐 Yetkilendirme

Aşağıdaki işlemleri yalnızca yetkili kullanıcılar gerçekleştirebilir:

* Lig oluşturma ve düzenleme. (Role Gamification Admin)
* Metrik ve puanlama kurallarını tanımlama.  (Role Gamification Admin)
* Round sonuçlarını onaylama. (League Referees)

<figure><img src="https://3582076375-files.gitbook.io/~/files/v0/b/gitbook-x-prod.appspot.com/o/spaces%2F-MGIlBSTjQtZxUoFwUx4%2Fuploads%2FTWLd8ShRmOvdnHYsHXGk%2Fimage.png?alt=media&amp;token=f73a7ee9-709a-4404-bd1e-d7282aa9e519" alt=""><figcaption><p>Manage user roles</p></figcaption></figure>


# Gamification

Automatically score engineering teams based on Engineering KPIs to boost performance and motivation.

Oobeya’s **Gamification** module provides a point-based competitive structure to boost engineering team performance. It visualizes progress, increases motivation, and highlights achievements. With this feature, you can create leagues, define performance metrics (Engineering KPIs), compare team scores, and reward high performance.

<figure><img src="https://3582076375-files.gitbook.io/~/files/v0/b/gitbook-x-prod.appspot.com/o/spaces%2F-MGIlBSTjQtZxUoFwUx4%2Fuploads%2FHxqtl9kUbZoescNlLyHO%2Fimage.png?alt=media&#x26;token=82ae69cf-b735-4068-9a28-2a236f56b75c" alt="Oobeya Gamification Module"><figcaption><p>Oobeya Gamification Module</p></figcaption></figure>

***

### Key Concepts

* **League**: A competition structure where teams collect points based on defined metrics.
* **Round**: Scoring periods executed at specific intervals (e.g., weekly, biweekly, monthly).
* **Referees**: Authorized users who supervise manual scoring and can update and approve results.
* **Points**: Numeric values assigned automatically or manually based on defined thresholds for KPIs.

***

### How It Works

<figure><img src="https://3582076375-files.gitbook.io/~/files/v0/b/gitbook-x-prod.appspot.com/o/spaces%2F-MGIlBSTjQtZxUoFwUx4%2Fuploads%2FPUVqWnP8mIFmBdiHB45D%2Fimage.png?alt=media&#x26;token=62c7cae1-2ed7-4c9f-8b90-a178eaca0906" alt=""><figcaption><p>Create New League - step by step</p></figcaption></figure>

{% stepper %}
{% step %}

### **1. League Setup**

Create a new league via:\
**Gamification > Leagues Management > New League**

Required fields:

* **League Name** and **Description**
* **Referees**: Minimum 1, maximum 5 users
* **Scoring Interval**: Weekly, biweekly, or monthly
* **Start / End Date** (optional)
* **League Logo** (optional)

{% hint style="info" %}
⚠️ If an end date is provided, it must be at least 28 days after the start date and no more than 365 days. If left empty, the league runs indefinitely.
{% endhint %}
{% endstep %}

{% step %}
**Metric Selection**

<figure><img src="https://3582076375-files.gitbook.io/~/files/v0/b/gitbook-x-prod.appspot.com/o/spaces%2F-MGIlBSTjQtZxUoFwUx4%2Fuploads%2F6EQqYHGXqfsgctae262d%2Fimage.png?alt=media&#x26;token=4efa50ec-d3c9-42d4-baef-38980b19f421" alt=""><figcaption><p>Metric Selection</p></figcaption></figure>

Select which performance metrics will be scored. Categories include:

* **Project Management** (e.g., Lead Time, Predictability)
* **Development** (e.g., Rework Rate, Coding Efficiency)
* **Code Review**
* **Code Quality**
* **Security**
* **Symptoms**

{% hint style="info" %}
These metrics will be used for **automatic scoring**.
{% endhint %}
{% endstep %}

{% step %}
**KPI Scoring**

<figure><img src="https://3582076375-files.gitbook.io/~/files/v0/b/gitbook-x-prod.appspot.com/o/spaces%2F-MGIlBSTjQtZxUoFwUx4%2Fuploads%2FQWGkELzEHWKpi2OU0HuL%2Fimage.png?alt=media&#x26;token=fd5d44fc-d66f-4a51-b38e-ce920dce41ab" alt=""><figcaption><p>KPI Scoring</p></figcaption></figure>

Define scoring thresholds for each metric. Example:

* Cycle Time < 3 days → 3 points
* 3–10 days → 1 point
* ≥10 days → 0 points

{% hint style="warning" %}
Ensuring logical consistency of thresholds is the user’s responsibility.
{% endhint %}
{% endstep %}

{% step %}
**Manual KPIs (Optional)**

<figure><img src="https://3582076375-files.gitbook.io/~/files/v0/b/gitbook-x-prod.appspot.com/o/spaces%2F-MGIlBSTjQtZxUoFwUx4%2Fuploads%2F8qvsP4jiFxrZ43w8P2XP%2Fimage.png?alt=media&#x26;token=e2fc62eb-b679-4948-9ad0-a170f3b72cd0" alt=""><figcaption><p>Manual KPIs</p></figcaption></figure>

Define custom KPIs that will be scored manually by referees.

Each manual KPI requires:

* Label (Name)
* Description
* Maximum Points
  {% endstep %}

{% step %}
**Team Selection**

<figure><img src="https://3582076375-files.gitbook.io/~/files/v0/b/gitbook-x-prod.appspot.com/o/spaces%2F-MGIlBSTjQtZxUoFwUx4%2Fuploads%2FGQhq7q6JE4ArZKPVXDU1%2Fimage.png?alt=media&#x26;token=a13da56d-8eb4-4abc-8a3e-46dca80374b1" alt=""><figcaption><p>Team Selection</p></figcaption></figure>

Select which teams will participate in the league. Only teams with data available for the selected metrics can be added.
{% endstep %}

{% step %}
**Final Review and Start**

Review all settings and click **Create League** to launch.
{% endstep %}
{% endstepper %}

***

#### Round Management:

Each league generates a scoring **round** automatically based on the selected interval.

League referees manage rounds via:\
**League Management > Manage Rounds**

<figure><img src="https://3582076375-files.gitbook.io/~/files/v0/b/gitbook-x-prod.appspot.com/o/spaces%2F-MGIlBSTjQtZxUoFwUx4%2Fuploads%2FmS5vgiEwenaAFnkiqdM5%2Fimage.png?alt=media&#x26;token=caad7134-81c2-481a-9514-162670fc7dcf" alt=""><figcaption><p>Manage Rounds</p></figcaption></figure>

**Round Details:**

<figure><img src="https://3582076375-files.gitbook.io/~/files/v0/b/gitbook-x-prod.appspot.com/o/spaces%2F-MGIlBSTjQtZxUoFwUx4%2Fuploads%2FbXzMiU36AnTvTitQouek%2Fimage.png?alt=media&#x26;token=d076476f-bd62-40ef-b23a-7a6710ff08f5" alt=""><figcaption></figcaption></figure>

* **Round Date**: The date when scores are calculated.
* **States**:
  * `Scheduled for the next round`
  * `In Progress`
  * `Pending Approval`
  * `Approved`
  * `Failed`
  * `Cancelled`

Referees can **review, edit, and approve** round scores.

***

#### ✏️ Update Scores

<figure><img src="https://3582076375-files.gitbook.io/~/files/v0/b/gitbook-x-prod.appspot.com/o/spaces%2F-MGIlBSTjQtZxUoFwUx4%2Fuploads%2F4YW842xAinNry9mS3pDX%2Fimage.png?alt=media&#x26;token=0ad3bb66-c443-4dc2-a482-b7fb9d958724" alt=""><figcaption><p>Update Scores for a round</p></figcaption></figure>

For each KPI, referees can:

* View the actual value (Value)
* Check the automatically calculated score (Calculated Score)
* Manually update scores if needed (Update)
* Approve scores (Approve)

> Use the **Recalculate** button (top right) to refresh all automatic scores.

***

#### 📊 Leaderboard

<figure><img src="https://3582076375-files.gitbook.io/~/files/v0/b/gitbook-x-prod.appspot.com/o/spaces%2F-MGIlBSTjQtZxUoFwUx4%2Fuploads%2FEpKnYL0ahYogJXgWG8Cb%2Fimage.png?alt=media&#x26;token=1500f60a-2af6-45e8-ad9b-f622e41a2579" alt=""><figcaption><p>Leaderboard</p></figcaption></figure>

The leaderboard displays team rankings based on their total points:

* Track progress over time
* View historical rounds
* See which metrics contributed to team scores.

***

#### 🔐 Authorization

The following actions can only be performed by authorized users:

* Creating and editing leagues (Role: Gamification Admin)
* Defining metrics and scoring rules (Role: Gamification Admin)
* Approving round results (Role: League Referee)

<figure><img src="https://3582076375-files.gitbook.io/~/files/v0/b/gitbook-x-prod.appspot.com/o/spaces%2F-MGIlBSTjQtZxUoFwUx4%2Fuploads%2FTWLd8ShRmOvdnHYsHXGk%2Fimage.png?alt=media&#x26;token=f73a7ee9-709a-4404-bd1e-d7282aa9e519" alt=""><figcaption><p>Manage user roles</p></figcaption></figure>


# Bug Report Modülü

Takımlarınızın yazılım geliştirme sürecinde oluşan hata kayıtlarını takip etmenizi sağlar.

Oobeya Bug Report modülü, Jira ve Azure Boards gibi proje yönetimi araçları üzerinden toplanan verilerle çalışarak takımlarınızın yazılım geliştirme sürecinde oluşan hata kayıtlarını takip etmenizi sağlar. Organizasyon düzeyinde açık ve kapalı bug'lara dair detaylı bir görünürlük sunar. Bu sayede yazılım kalitesini artırmaya yönelik veriye dayalı kararlar alabilir, darboğazları erken aşamada tespit edebilirsiniz.

### Genel Özellikler

* Tüm organizasyon için merkezi bir rapor görünümü&#x20;
* Takım bazlı filtreleme ve analiz
* Zaman aralıklarına göre görünüm (günlük, haftalık, aylık, çeyreklik)
* Açık bug trendlerini görselleştirme
* Önem Derecesi (Severity) dağılımı
* Takım bazlı bug dağılımı
* Detaylı bug listesi (Work item, Assignee, Project, Status, vb.)

***

### Ön Gereksinimler (Admin Ayarları)

Bug Report modülünün doğru çalışabilmesi için **Admin Paneli** üzerinden bazı temel konfigürasyonlar yapılmalıdır.

#### 1. Category Mapping Settings

`Administration > AgileSpace` altında, **Bug Fixing** kategorisine karşılık gelen iş tipleri (örn. Bug, Defect, Problem, Incident, Error) belirlenmelidir.

{% hint style="warning" %}
Bu tanımlama yapılmadığı takdirde, ilgili iş tipleri bug olarak sınıflandırılamaz ve rapora yansımaz.
{% endhint %}

<figure><img src="https://3582076375-files.gitbook.io/~/files/v0/b/gitbook-x-prod.appspot.com/o/spaces%2F-MGIlBSTjQtZxUoFwUx4%2Fuploads%2FZzIW76y26Xvzw4FABiyk%2Fimage.png?alt=media&amp;token=2b7f5491-6ad0-43f4-b59d-e88d2daeaf26" alt=""><figcaption><p>Category Mapping</p></figcaption></figure>

#### 2. Severity Mapping

Bug'ların önem derecelerini belirlemek için Jira ve Azure Boards sisteminizdeki severity alanlarını Oobeya'nın sınıfları ile eşleştirin.

* **Jira için**: `Priority` alanından `Highest`, `High`, `Medium`, `Low`, vb.
* **Azure için**: Sayısal olarak sıralanmış severity seviyeleri ile (1 - Critical, 2 - High, vb.)

Değişiklikler yapıldığında geçmiş veriler yeniden analiz edilir.

<figure><img src="https://3582076375-files.gitbook.io/~/files/v0/b/gitbook-x-prod.appspot.com/o/spaces%2F-MGIlBSTjQtZxUoFwUx4%2Fuploads%2F3pUR1S1dTlmpkx86oNJd%2Fimage.png?alt=media&amp;token=fab07836-8733-4612-a0d0-992363f4ecf9" alt=""><figcaption><p>Severity Mapping</p></figcaption></figure>

***

### Dashboard Bileşenleri

#### 1. Open Bugs Over Time

Zaman içinde açık kalan bug'ların seviyelerine göre (*Blocker, Critical, High, Medium, Low*) trendini gösterir.

* **İnteraktif grafik**: Üzerine gelindiğinde her haftalık/aylık dilimdeki bug sayıları önem derecesine göre detaylı görüntülenir.
* **Zaman filtresi**: Son 7 gün, Son 30 gün, Aylık, Çeyreklik seçimi, özel tarih aralığı gibi esnek zaman filtreleri.

<figure><img src="https://3582076375-files.gitbook.io/~/files/v0/b/gitbook-x-prod.appspot.com/o/spaces%2F-MGIlBSTjQtZxUoFwUx4%2Fuploads%2FnSMZ4IAhpceyUmRxJFf3%2Fimage.png?alt=media&amp;token=c892aed8-e48f-43b7-a743-8fc40fe3aed3" alt=""><figcaption><p>Open Bugs Over Time</p></figcaption></figure>

***

#### 2. Bug Severity Summary

Bug'ların önem derecelerine göre dağılımını gösterir.

<figure><img src="https://3582076375-files.gitbook.io/~/files/v0/b/gitbook-x-prod.appspot.com/o/spaces%2F-MGIlBSTjQtZxUoFwUx4%2Fuploads%2F9jNhZKoRlgkAiiE2B2dV%2Fimage.png?alt=media&amp;token=9bde15fb-874b-416e-801e-afd3e4512b3a" alt="" width="375"><figcaption><p>Bug Severity</p></figcaption></figure>

***

#### 3. Bug Distribution by Team

Hangi takımda kaç bug olduğu ve hangi takımların daha fazla bug açtığı analiz edilir.

* Pie chart görünümü
* Yüksek sayıda bug barındıran takımların kolayca tespiti

<figure><img src="https://3582076375-files.gitbook.io/~/files/v0/b/gitbook-x-prod.appspot.com/o/spaces%2F-MGIlBSTjQtZxUoFwUx4%2Fuploads%2F6hyei25xd3zuvUnZtTzv%2Fimage.png?alt=media&amp;token=9a2a403e-ea7e-4b14-a244-0e2b86e58612" alt=""><figcaption><p>Bug Distribution By Team</p></figcaption></figure>

***

#### 4. Bug Details

Tüm bug'ların detaylarını içerir:

* Work item ID
* Özet
* Atanan kişi (Assignee)
* Proje ve takım
* Tip, Severity, Durum, Tarihler

<figure><img src="https://3582076375-files.gitbook.io/~/files/v0/b/gitbook-x-prod.appspot.com/o/spaces%2F-MGIlBSTjQtZxUoFwUx4%2Fuploads%2FdX5qTPJ2vRPbI7sWQFhz%2FScreenshot%202025-09-05%20at%2017.33.18.png?alt=media&amp;token=a158d8d9-a73e-4aaa-bcf3-968b39621ff2" alt=""><figcaption><p>Bug Details Table</p></figcaption></figure>

***

### SSS (Sıkça Sorulan Sorular)

<details>

<summary>Bu modül tüm kullanıcılar tarafından kullanılabilir mi?</summary>

Evet, Bug Report Dashboard organizasyon seviyesinde açılır. Ancak kullanıcılar sadece kendi takımlarını filtreleyerek analiz yapabilir.

</details>

<details>

<summary>Severity seviyeleri neden doğru görünmüyor?</summary>

Admin Panel'deki severity mapping ayarlarını kontrol edin. Jira ya da Azure Boards’taki alanlar doğru eşlenmemiş olabilir.

</details>

<details>

<summary>Bug sayısı ile Jira/Azure’daki sayı farklı. Neden?</summary>

Kategori eşlemesi ya da iş tipi hariç tutulması nedeniyle bazı bug'lar dashboard'a dahil edilmemiş olabilir.

</details>

***

### Sonuç

Bug Report modülü, hata yönetimini kolaylaştırmak ve yazılım kalitesini iyileştirmek isteyen takımlar için güçlü bir analiz aracıdır. Doğru yapılandırmalarla birlikte kullanıldığında, hata yoğunlukları, çözüm süreleri ve riskli bölgeler kolayca görselleştirilebilir.


# Bug Report

Helps you monitor bug reports occurring during your teams' software development processes.

The Oobeya Bug Report module helps you track bug records occurring during your teams' software development processes by collecting data from project management tools such as Jira and Azure Boards. It provides organization and team-level visibility into open and closed bugs. This empowers you to make data-driven decisions that improve software quality and detect bottlenecks at an early stage.

### Key Features

* Centralized reporting view across the entire organization
* Team-level filtering and analysis
* Multiple time interval views (*daily, weekly, monthly, quarterly*)
* Visualizations of open bug trends
* Severity distribution analysis
* Bug distribution by team
* Detailed bug list: Team Bugs, Unassigned Bugs, Other Teams' Bugs (*Work item, Assignee, Project, Status*, etc.)

***

### Prerequisites (Admin Settings)

To ensure the Bug Report module functions correctly, certain configurations must be completed in the **Admin Panel**.

#### **1. Category Mapping Settings**

Under `Administration > AgileSpace`, define the relevant issue types (*e.g., Bug, Defect, Problem, Incident, Error*) mapped to the **Bug Fixing** category.

{% hint style="warning" %}
If this mapping is not configured, related work items will not be classified as bugs and won't be reflected in the report.
{% endhint %}

<figure><img src="https://3582076375-files.gitbook.io/~/files/v0/b/gitbook-x-prod.appspot.com/o/spaces%2F-MGIlBSTjQtZxUoFwUx4%2Fuploads%2FZzIW76y26Xvzw4FABiyk%2Fimage.png?alt=media&#x26;token=2b7f5491-6ad0-43f4-b59d-e88d2daeaf26" alt=""><figcaption><p>Category Mapping</p></figcaption></figure>

#### **2. Severity Mapping**

To classify bugs by severity level, map the severity fields from Jira or Azure Boards to Oobeya’s predefined severity categories.

* **For Jira**: Map values from the `Priority` field such as `Highest`, `High`, `Medium`, `Low`, etc.
* **For Azure**: Use numeric values sorted by criticality (e.g., 1 - Critical, 2 - High, etc.)

Changes in these settings will trigger a reanalysis of historical data.

<figure><img src="https://3582076375-files.gitbook.io/~/files/v0/b/gitbook-x-prod.appspot.com/o/spaces%2F-MGIlBSTjQtZxUoFwUx4%2Fuploads%2F3pUR1S1dTlmpkx86oNJd%2Fimage.png?alt=media&#x26;token=fab07836-8733-4612-a0d0-992363f4ecf9" alt=""><figcaption><p>Severity Mapping</p></figcaption></figure>

***

### Dashboard Components

#### **1. Open Bugs Over Time**

Displays the trend of open bugs over time, broken down by severity levels (*Blocker, Critical, High, Medium, Low*).

* **Interactive chart**: Hover to view detailed counts of bugs per severity for each time interval.
* **Time filter options**: Choose from *Last 7 Days, Last 30 Days, Monthly, Quarterly*, or custom date ranges.

<figure><img src="https://3582076375-files.gitbook.io/~/files/v0/b/gitbook-x-prod.appspot.com/o/spaces%2F-MGIlBSTjQtZxUoFwUx4%2Fuploads%2FnSMZ4IAhpceyUmRxJFf3%2Fimage.png?alt=media&#x26;token=c892aed8-e48f-43b7-a743-8fc40fe3aed3" alt=""><figcaption><p>Open Bugs Over Time</p></figcaption></figure>

***

#### **2. Bug Severity Summary**

Displays the distribution of bugs by severity level.

<figure><img src="https://3582076375-files.gitbook.io/~/files/v0/b/gitbook-x-prod.appspot.com/o/spaces%2F-MGIlBSTjQtZxUoFwUx4%2Fuploads%2F9jNhZKoRlgkAiiE2B2dV%2Fimage.png?alt=media&#x26;token=9bde15fb-874b-416e-801e-afd3e4512b3a" alt="" width="375"><figcaption><p>Bug Severity</p></figcaption></figure>

***

#### **3. Bug Distribution by Team**

Displays the number of bugs per team and helps identify which teams are reporting the most bugs.

* Pie chart visualization
* Quick identification of high-volume bug teams

<figure><img src="https://3582076375-files.gitbook.io/~/files/v0/b/gitbook-x-prod.appspot.com/o/spaces%2F-MGIlBSTjQtZxUoFwUx4%2Fuploads%2F6hyei25xd3zuvUnZtTzv%2Fimage.png?alt=media&#x26;token=9a2a403e-ea7e-4b14-a244-0e2b86e58612" alt=""><figcaption><p>Bug Distribution By Team</p></figcaption></figure>

***

#### **4. Bug Details**

Displays a full list of bugs, including:

* Work item ID
* Summary
* Assignee
* Project and Team
* Type, Severity, Status, and Date fields

<figure><img src="https://3582076375-files.gitbook.io/~/files/v0/b/gitbook-x-prod.appspot.com/o/spaces%2F-MGIlBSTjQtZxUoFwUx4%2Fuploads%2FdX5qTPJ2vRPbI7sWQFhz%2FScreenshot%202025-09-05%20at%2017.33.18.png?alt=media&#x26;token=a158d8d9-a73e-4aaa-bcf3-968b39621ff2" alt=""><figcaption><p>Bug Details Table</p></figcaption></figure>

***

### FAQ (Frequently Asked Questions)

<details>

<summary><strong>Is this module available to all users?</strong></summary>

Yes. The Bug Report Dashboard is available organization-wide. Users can filter results based on the teams to which they belong.

</details>

<details>

<summary><strong>Why are severity levels not showing correctly?</strong></summary>

Please verify your severity mapping settings in the Admin Panel. The fields in Jira or Azure Boards might not be correctly matched to Oobeya's categories.

</details>

<details>

<summary><strong>Why is the bug count different from what's shown in Jira or Azure?</strong></summary>

This might be due to incorrect category mapping or excluded work item types in your configuration.
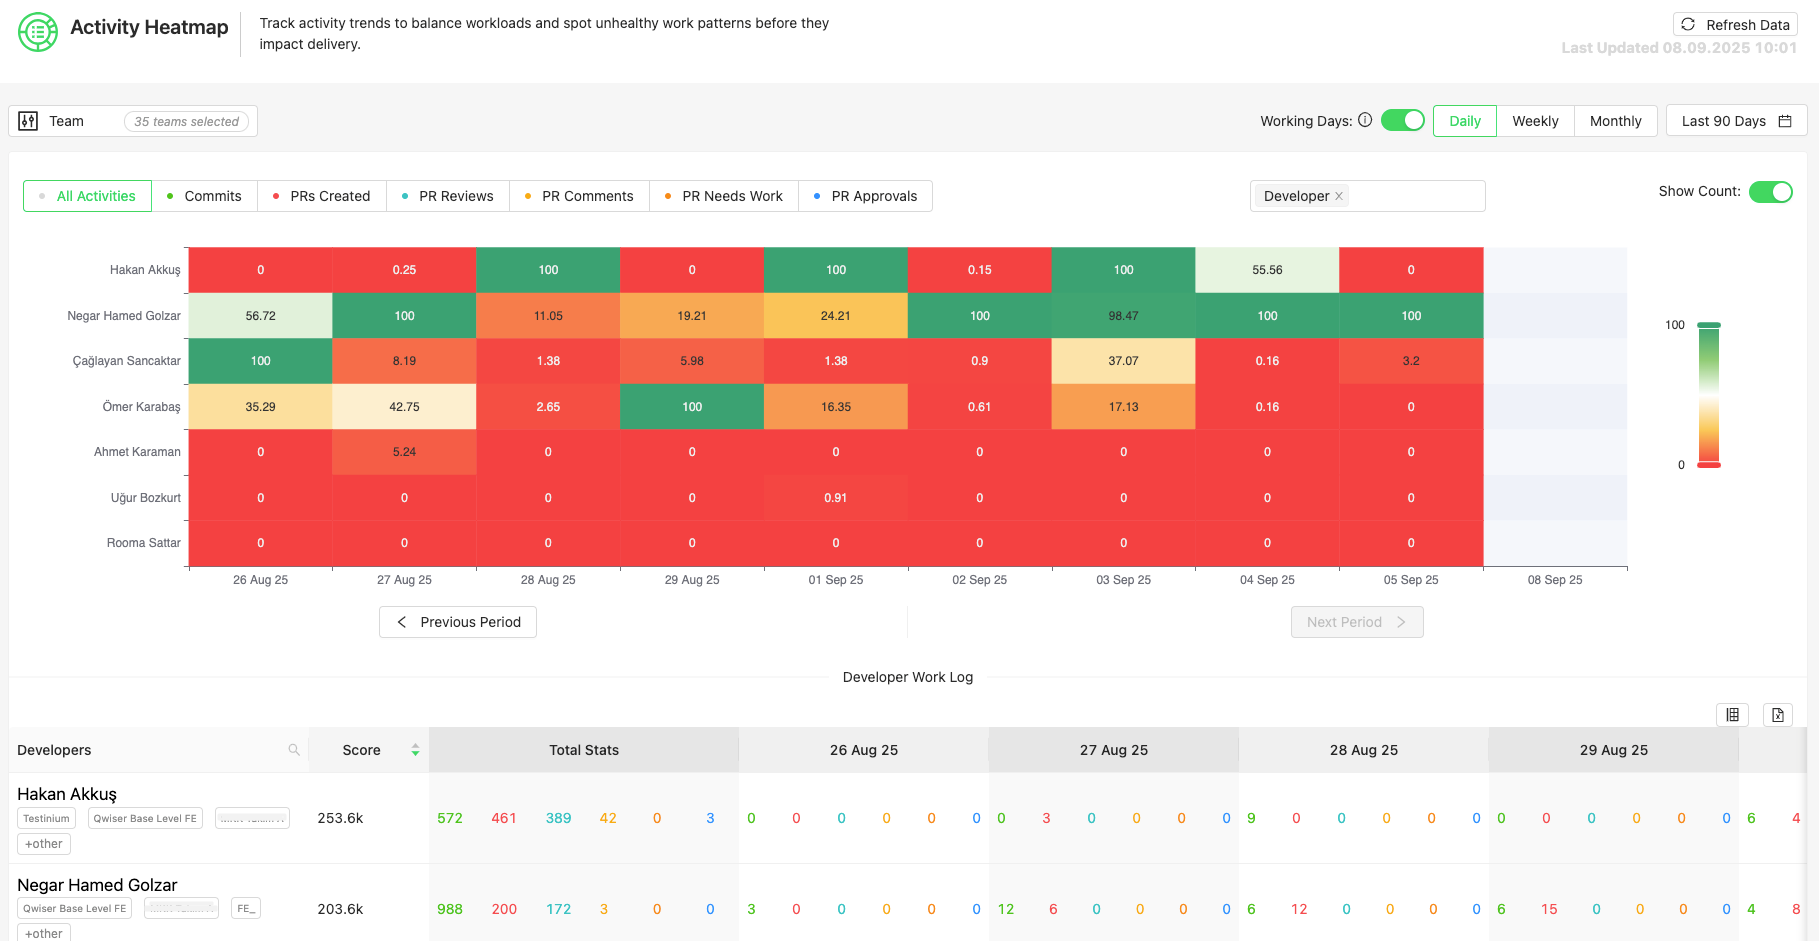
</details>

***

### Conclusion

The Bug Report module is a powerful tool for teams aiming to streamline issue tracking and improve software quality. When properly configured, it enables clear visibility into bug volume, resolution trends, and risk zones.


# Aktivite Isı Haritası (Activity Heatmap)

Geliştirici aktivitelerini görselleştirerek iş yükü dengesizliklerini ve sağlıksız çalışma pratiklerini tespit etmenizi sağlar.

Oobeya **Activity Heatmap** modülü, yazılım geliştirme ekiplerinin günlük aktivitelerini görselleştirerek, **iş yükü dağılımını**, **katkı çeşitliliğini** ve **geliştirici deneyimini** analiz etmeyi sağlar. Commit, Pull Request (code review), kod değişiklikleri ve yorumları gibi çeşitli aktiviteleri skorlayarak zaman içindeki eğilimleri ısı haritası formatında sunar.

Bu modül sayesinde:

* Aşırı yüklenmiş veya düşük katkı sağlayan geliştiriciler belirlenebilir.
* Dengesiz iş yükü dağılımları tespit edilir.
* Takım içinde adil görev paylaşımı teşvik edilir.

***

### 1. Genel Özellikler

* Günlük, haftalık, aylık, çeyreklik veya özel tarih aralığında analiz
* PR, commit, kod satır değişiklikleri ve kod gözden geçirme yorum aktivitelerinin takibi
* Geliştirici bazında renkli ısı haritası görünümü
* Geliştirici İş Günlüğü (Work Log) ile detaylı süreç katkı analizi
* Takım seçimi ve rol bazlı filtreleme
* Çalışma günü filtresi (Admin Panel > General Settings üzerinden yapılandırılır)

<figure><img src="https://3582076375-files.gitbook.io/~/files/v0/b/gitbook-x-prod.appspot.com/o/spaces%2F-MGIlBSTjQtZxUoFwUx4%2Fuploads%2FnEJ2Mw9DOl1Yt1LU0XiI%2Fimage.png?alt=media&amp;token=6524f1c1-2b3b-4bcd-827f-d53644ea5972" alt=""><figcaption><p>Activity Heatmap Genel Görünüm</p></figcaption></figure>

***

### 2. Skor Hesaplama Mekanizması

**Activity Heatmap** modülünde geliştirici aktiviteleri farklı katkı türlerinden alınan verilerle hesaplanır ve normalize edilerek ısı haritasında görselleştirilir.

#### 2.1. Günlük Normalizasyon & Z-Skor:

1. Her günün en yüksek skor alan geliştiricisi %100 referans olarak alınır.
2. Diğer geliştiriciler bu maksimum değere oranlanır → `rank_ratio`
3. Günlük katkılar normalize edilir.
4. Tüm geliştiricilerin ortalama oranı ve standart sapması hesaplanır.
5. Bu oranlar **z-skoruna** çevrilerek 0–100 aralığına normalize edilir.
6. Isı haritasında bu skorlar renk tonlarına dönüştürülür.

#### 2.2. Aktivite Bazlı Skor Formülleri:

**2.2.1. Commit Aktiviteleri:**

```
COMMIT_SCORE = (COMMITS × commit_coeff) +
               (LINES_ADDED × added_coeff) +
               (LINES_DELETED × deleted_coeff) +
               (LINES_EDITED × edited_coeff)
```

**2.2.2. Pull Request Aktiviteleri:**

```
PR_OPEN_SCORE        = PRs Created × pr_open_coeff
PR_REVIEW_SCORE      = PR Reviews × pr_review_coeff
PR_APPROVAL_SCORE    = PR Approvals × pr_approve_coeff
PR_NEEDS_WORK_SCORE  = PR Needs Work × pr_needs_work_coeff
PR_COMMENT_SCORE     = PR Comments × pr_comment_coeff
```

**2.2.3. Toplam Skor:**

```
TOTAL_RANK_SCORE = COMMIT_SCORE + PR_OPEN_SCORE + PR_REVIEW_SCORE +
                   PR_APPROVAL_SCORE + PR_NEEDS_WORK_SCORE + PR_COMMENT_SCORE
```

**2.2.4. Isı Haritasına Yansıtma:**

* Normalize edilen skorlar renk tonlarına dönüştürülür.
* Koyu renkler yüksek aktiviteyi, açık renkler düşük aktiviteyi gösterir.

{% hint style="info" %}
Bu mekanizma sayesinde ekipler arasında **adil karşılaştırmalar** yapılabilir, farklı aktivite türlerinin etkisi organizasyon ihtiyaçlarına göre ayarlanabilir ve sonuçlar görsel olarak kolayca takip edilebilir.
{% endhint %}

***

### 3. Admin Panel Ayarları

Farklı faaliyetlere ağırlık değerleri atanır. Bu katsayılar, her bir faaliyet türünün genel ısı haritası skorunu ve sıcaklık görselleştirmesini nasıl etkilediğini belirler.

**Konum:** `Administration > Activity Heatmap`

#### Katsayı (Coefficient) Ayarları

Her aktivite türü için, katkının toplam skor üzerindeki ağırlığını belirleyebilirsiniz.

<table><thead><tr><th width="211.52728271484375">Aktivite</th><th width="395.47412109375">Açıklama</th><th>Varsayılan</th></tr></thead><tbody><tr><td>Commits</td><td>Yapılan commit sayısı</td><td>2.0</td></tr><tr><td>Lines Added</td><td>Eklenen kod satırı</td><td>0.1</td></tr><tr><td>Lines Deleted</td><td>Silinen kod satırı</td><td>0.1</td></tr><tr><td>Lines Edited</td><td>Değiştirilen kod satırı</td><td>0.1</td></tr><tr><td>PRs Created</td><td>Açılan PR sayısı</td><td>1.0</td></tr><tr><td>PR Reviews</td><td>Yapılan kod incelemeleri</td><td>1.5</td></tr><tr><td>PR Approvals</td><td>Onaylanan PR sayısı</td><td>0.25</td></tr><tr><td>PR Needs Work</td><td>Geri gönderilen PR sayısı</td><td>0.5</td></tr><tr><td>PR Comments</td><td>PR’lerde yapılan yorum sayısı</td><td>1.0</td></tr></tbody></table>

<figure><img src="https://your-link.com/activity_heatmap_admin.png" alt=""><figcaption><p>Admin Panel – Activity Coefficients</p></figcaption></figure>

***

### 4. Dashboard Bileşenleri

**Activity Heatmap Dashboard**, geliştiricilerin günlük aktivitelerini farklı açılardan analiz edebilmeniz için birden fazla bileşenden oluşur. Her bileşen, katkı türlerini, zaman içindeki eğilimleri ve ekip içindeki dağılımları farklı perspektiflerden görselleştirir.

#### 4.1. Etkinlik Isı Haritası (Activity Heatmap)

**Activity Heatmap**, geliştiricilerin günlük aktivitelerini görselleştiren temel bileşendir. Her hücre, bir geliştiricinin belirli bir gündeki katkı skorunu temsil eder.

* **Renk Yoğunluğu**: Hücrenin rengi, geliştiricinin o günkü performans seviyesini yansıtır. Daha koyu tonlar yüksek aktiviteyi, daha açık tonlar düşük aktiviteyi gösterir.
* **Normalize Edilmiş Skorlar**: Günlük skorlar, o günün en yüksek katkısına göre normalize edilerek %0–%100 aralığına dönüştürülür. Bu sayede farklı günler ve geliştiriciler arasında adil bir karşılaştırma yapılabilir.
* **Zaman Filtreleri**: Günlük, haftalık, aylık ya da özel tarih aralıklarına göre analiz yapılabilir.

{% hint style="info" %}
Activity Heatmap, ekiplerin iş yükü dengesizliklerini görsel olarak fark etmesini ve potansiyel aşırı yüklenmeleri ya da düşük katılımları hızlıca tespit etmesini sağlar.
{% endhint %}

<figure><img src="https://3582076375-files.gitbook.io/~/files/v0/b/gitbook-x-prod.appspot.com/o/spaces%2F-MGIlBSTjQtZxUoFwUx4%2Fuploads%2FdzrUeZKfzaFD1eAfaVBn%2Fimage.png?alt=media&amp;token=f314684d-e1d1-4008-aa3b-8a186e77f3a3" alt=""><figcaption><p>Activity Heatmap</p></figcaption></figure>

#### 4.2. Geliştirici İş Günlüğü (Developer Work Log)

**Developer Work Log**, seçilen tarih aralığında her geliştiricinin günlük aktivitelerini ayrıntılı olarak listeler. Isı haritası üzerinde görülen skorların arka planındaki ham verileri tablo formatında sunar.

Bu bölümde:

* **Geliştirici bazında toplam skor** (normalize edilmiş)
* **Toplam aktivite sayıları** (commit, PR, yorum vb.)
* **Günlük katkı hücreleri** ile her gün için yapılan aktiviteler ve bu aktivitelerin puan karşılıkları

görüntülenir.

{% hint style="info" %}
Amaç, sadece genel skorlara bakmakla kalmayıp, her bir geliştiricinin hangi günlerde daha aktif olduğunu ve hangi katkı türlerinde yoğunlaştığını ayrıntılı şekilde analiz etmektir.
{% endhint %}

<figure><img src="https://3582076375-files.gitbook.io/~/files/v0/b/gitbook-x-prod.appspot.com/o/spaces%2F-MGIlBSTjQtZxUoFwUx4%2Fuploads%2Frw1yvXBqpUwtR0KZJARR%2Fimage.png?alt=media&amp;token=147fe9f8-45f8-46c4-9084-d62661fc99be" alt=""><figcaption><p>Developer Work Log</p></figcaption></figure>

#### 4.3. Filtreler

**Activity Heatmap** modülü, daha odaklı ve anlamlı analizler yapabilmeniz için çeşitli filtreleme seçenekleri sunar:

* **Çalışma Günleri (Working Days)**: Skorların yalnızca şirketinizin tanımlı çalışma günleri (örn. Pazartesi–Cuma) üzerinden hesaplanmasını sağlar. Bu ayar, **Admin > General Settings** bölümünden yapılandırılır.
* **Takım Seçimi (Team Selection)**: Bir veya birden fazla takım seçilerek, ısı haritasında yalnızca bu takımlara ait aktiviteler görüntülenebilir.
* **Rol Filtresi (Role Filter)**: Organizasyon içindeki belirli roller (örn. Developer, QA) seçilerek, sadece bu rollerin aktiviteleri analizlere dahil edilir. Bu sayede doğrudan geliştirme dışındaki katkılar hariç tutulabilir.
* **Aktivite Türü (Activity Type)**: İstenilen aktivite türleri (Commit, PR açma, Review, Yorum vb.) seçilerek, ısı haritası sadece bu aktiviteler üzerinden görüntülenebilir.

{% hint style="info" %}
Bu filtreler sayesinde ekipler, belirli zaman aralıklarında, belirli roller veya aktiviteler özelinde, çok daha net ve hedefli içgörüler elde edebilir.
{% endhint %}

<figure><img src="https://3582076375-files.gitbook.io/~/files/v0/b/gitbook-x-prod.appspot.com/o/spaces%2F-MGIlBSTjQtZxUoFwUx4%2Fuploads%2FG2L0nFndIQtLHR7Azfy0%2Fimage.png?alt=media&amp;token=fb40c6c8-62e3-476c-8cf4-87458a748cc9" alt="" width="461"><figcaption><p>Modül Filtreleri</p></figcaption></figure>

***

### 5. Veri Kaynakları

**Activity Heatmap** modülü, geliştirici aktivitelerini hesaplamak için farklı yazılım geliştirme araçlarından ve katkı türlerinden veri toplar.

* **Commits**: Git repository’lerindeki commit kayıtları  (*Azure DevOps, GitHub, GitLab, Bitbucket, Gitea*)
* **Kod Değişiklikleri**: Eklenen, silinen ve düzenlenen satır sayıları
* **Pull Requestler**: Açılan PR’lar (GitHub, GitLab, Bitbucket, Azure Repos vb.)
* **Kod İncelemeleri (Reviews)**: Yapılan kod incelemeleri, onaylanan veya geri gönderilen PR’lar
* **Yorumlar (Comments)**: Pull request üzerinde yapılan yorumlar
* **Developer Profiles**: Yalnızca Oobeya’da tanımlı geliştirici profillerinin aktiviteleri hesaplamaya dahil edilir.

{% hint style="info" %}
Bu kaynaklardan gelen veriler, admin panelde tanımlanan katsayılarla ağırlıklandırılarak toplam skora dönüştürülür.
{% endhint %}

***

### 6. Önerilen Kullanımlar

**Activity Heatmap** modülü, ekip aktivitelerinin daha adil, dengeli ve verimli hale getirilmesi için farklı senaryolarda kullanılabilir:

<table><thead><tr><th width="218.51544189453125">Senaryo</th><th>Kazanım</th></tr></thead><tbody><tr><td><strong>Sprint Değerlendirmeleri</strong></td><td>Sprint sonunda geliştiricilerin katkı yoğunluklarını analiz ederek daha sağlıklı retrospektifler yapılmasını sağlar.</td></tr><tr><td><strong>İş Yükü Dengesi</strong></td><td>Aşırı yüklenen veya düşük katılım gösteren ekip üyelerini belirleyerek görev dağılımını dengeler.</td></tr><tr><td><strong>Katılım ve Motivasyon</strong></td><td>Düzenli olarak düşük katkı yapan geliştiricileri tespit ederek motivasyon artırıcı aksiyonlar alınmasını sağlar.</td></tr><tr><td><strong>PR İnceleme Kültürü</strong></td><td>Kod inceleme, yorum ve onay aktiviteleri üzerinden ekiplerin review kültürünü ölçmeye yardımcı olur.</td></tr><tr><td><strong>Performans İyileştirme</strong></td><td>Ekiplerin iş birliği ve katkı çeşitliliğini izleyerek eğitim ve koçluk ihtiyaçlarını ortaya çıkarır.</td></tr></tbody></table>

{% hint style="info" %}
Bu modül yalnızca bireysel performans ölçümü için değil, aynı zamanda ekiplerin **katılım seviyesini** ve **iş yükü dengesini** izlemek için de güçlü bir takım yönetimi aracıdır.
{% endhint %}

***

### 7. SSS (Sıkça Sorulan Sorular)

<details>

<summary>Neden bazı geliştiriciler hiç görünmüyor?</summary>

Sadece Oobeya platformunda kayıtlı ve aktif takımlara atanmış geliştiricilerin aktiviteleri analiz edilir.

</details>

<details>

<summary>Skorlar neye göre belirleniyor?</summary>

Her aktiviteye ait katkı, admin paneldeki katsayılarla çarpılarak toplanır. Bu skor günlük normalize edilir.

</details>

<details>

<summary>Çalışma günü filtresi ne işe yarar?</summary>

Hafta sonu gibi çalışma günü dışındaki günlerin analiz dışında tutulmasını sağlar.

</details>


# Activity Heatmap

Helps visualize developer activities to detect workload imbalances and unhealthy work practices.

The Oobeya **Activity Heatmap** module visualizes the daily activities of software development teams, helping analyze **workload distribution**, **contribution diversity**, and **developer experience**. It scores various activities such as commits, pull requests (code reviews), code changes, and comments, and presents trends over time in a heatmap format.

With this module, you can:

* Identify overloaded or under-contributing developers.
* Detect unbalanced workload distributions.
* Encourage fairer task sharing within teams.

***

### 1. Key Features

* Analysis by daily, weekly, monthly, quarterly, or custom time range
* Tracking of PR, commit, code line changes, and code review comments
* Color-coded heatmap view by developer
* Developer Work Log with detailed contribution analysis
* Team selection and role-based filtering
* Working days filter (configured under Admin Panel > General Settings)

<figure><img src="https://3582076375-files.gitbook.io/~/files/v0/b/gitbook-x-prod.appspot.com/o/spaces%2F-MGIlBSTjQtZxUoFwUx4%2Fuploads%2FnEJ2Mw9DOl1Yt1LU0XiI%2Fimage.png?alt=media&#x26;token=6524f1c1-2b3b-4bcd-827f-d53644ea5972" alt=""><figcaption><p>Activity Heatmap Overview</p></figcaption></figure>

***

### 2. Scoring Mechanism

In the **Activity Heatmap** module, developer activities are calculated using data from different contribution types and normalized for visualization in the heatmap.

#### 2.1. Daily Normalization & Z-Score

1. The highest-scoring developer each day is taken as the 100% reference.
2. Other developers are scaled against this maximum → `rank_ratio`.
3. Daily contributions are normalized.
4. The average ratio and standard deviation of all developers are calculated.
5. Ratios are converted to **z-scores** and normalized into the 0–100 range.
6. These scores are mapped into color tones in the heatmap.

#### 2.2. Activity-Based Score Formulas

**2.2.1. Commit Activities**

```
COMMIT_SCORE = (COMMITS × commit_coeff) +
               (LINES_ADDED × added_coeff) +
               (LINES_DELETED × deleted_coeff) +
               (LINES_EDITED × edited_coeff)
```

**2.2.2. Pull Request Activities**

```
PR_OPEN_SCORE        = PRs Created × pr_open_coeff
PR_REVIEW_SCORE      = PR Reviews × pr_review_coeff
PR_APPROVAL_SCORE    = PR Approvals × pr_approve_coeff
PR_NEEDS_WORK_SCORE  = PR Needs Work × pr_needs_work_coeff
PR_COMMENT_SCORE     = PR Comments × pr_comment_coeff
```

**2.2.3. Total Score**

```
TOTAL_RANK_SCORE = COMMIT_SCORE + PR_OPEN_SCORE + PR_REVIEW_SCORE +
                   PR_APPROVAL_SCORE + PR_NEEDS_WORK_SCORE + PR_COMMENT_SCORE
```

**2.2.4. Heatmap Visualization**

* Normalized scores are mapped into color tones.
* Darker tones represent higher activity, lighter tones represent lower activity.

{% hint style="info" %}
This mechanism ensures **fair comparisons** across teams, allows organizations to adjust the impact of different activity types, and provides results that are easy to track visually.
{% endhint %}

***

### 3. Admin Panel Settings

Weight values are assigned to different activities. These coefficients determine how each activity type influences the overall heatmap score and visualization.

**Location:** `Administration > Activity Heatmap`

#### Coefficient Settings

For each activity type, you can define its weight on the total score.

<table><thead><tr><th width="211.52728271484375">Activity</th><th width="395.47412109375">Description</th><th>Default</th></tr></thead><tbody><tr><td>Commits</td><td>Number of commits made</td><td>2.0</td></tr><tr><td>Lines Added</td><td>Number of lines of code added</td><td>0.1</td></tr><tr><td>Lines Deleted</td><td>Number of lines of code deleted</td><td>0.1</td></tr><tr><td>Lines Edited</td><td>Number of lines of code modified</td><td>0.1</td></tr><tr><td>PRs Created</td><td>Number of pull requests created</td><td>1.0</td></tr><tr><td>PR Reviews</td><td>Number of code reviews performed</td><td>1.5</td></tr><tr><td>PR Approvals</td><td>Number of pull requests approved</td><td>0.25</td></tr><tr><td>PR Needs Work</td><td>Number of pull requests sent back for changes</td><td>0.5</td></tr><tr><td>PR Comments</td><td>Number of comments made on pull requests</td><td>1.0</td></tr></tbody></table>

<figure><img src="https://your-link.com/activity_heatmap_admin.png" alt=""><figcaption><p>Admin Panel – Activity Coefficients</p></figcaption></figure>

***

### 4. Dashboard Components

The **Activity Heatmap Dashboard** consists of multiple components to analyze daily developer activities from different perspectives. Each component visualizes contribution types, trends over time, and distribution within teams.

#### 4.1. Activity Heatmap

**Activity Heatmap** is the core component that visualizes developers’ daily activities. Each cell represents a developer’s contribution score for a given day.

* **Color Intensity**: The cell’s color reflects the developer’s performance level that day. Darker tones represent higher activity, lighter tones lower activity.
* **Normalized Scores**: Daily scores are normalized against the highest contribution of the day, ensuring fair comparisons between developers and across days.
* **Time Filters**: Analysis can be done daily, weekly, monthly, or within custom date ranges.

{% hint style="info" %}
The Activity Heatmap helps teams visually detect workload imbalances and quickly identify potential overload or low participation.
{% endhint %}

<figure><img src="https://3582076375-files.gitbook.io/~/files/v0/b/gitbook-x-prod.appspot.com/o/spaces%2F-MGIlBSTjQtZxUoFwUx4%2Fuploads%2FdzrUeZKfzaFD1eAfaVBn%2Fimage.png?alt=media&#x26;token=f314684d-e1d1-4008-aa3b-8a186e77f3a3" alt=""><figcaption><p>Activity Heatmap</p></figcaption></figure>

#### 4.2. Developer Work Log

The **Developer Work Log** provides a detailed list of daily activities for each developer within the selected date range. It provides the raw data behind the scores displayed in the heatmap in a tabular format.

This section shows:

* **Total score by developer** (normalized)
* **Total activity counts** (commits, PRs, comments, etc.)
* **Daily contribution cells** with activity counts and corresponding points

{% hint style="info" %}
The goal is not only to view general scores, but also to analyze in detail which days each developer was more active and which types of contributions they focused on.
{% endhint %}

<figure><img src="https://3582076375-files.gitbook.io/~/files/v0/b/gitbook-x-prod.appspot.com/o/spaces%2F-MGIlBSTjQtZxUoFwUx4%2Fuploads%2Frw1yvXBqpUwtR0KZJARR%2Fimage.png?alt=media&#x26;token=147fe9f8-45f8-46c4-9084-d62661fc99be" alt=""><figcaption><p>Developer Work Log</p></figcaption></figure>

#### 4.3. Filters

The **Activity Heatmap** module offers various filtering options to enable more focused and meaningful analysis:

* **Working Days**: Ensures scores are calculated only based on your company’s defined working days (e.g., Monday–Friday). Configurable in **Admin > General Settings**.
* **Team Selection**: Select one or more teams to view only their activities in the heatmap.
* **Role Filter**: Choose specific roles (e.g., Developer, QA) to include only those roles in the analysis. Non-development contributions can be excluded.
* **Activity Type**: Select desired activity types (commits, PR creation, reviews, comments, etc.) to filter the heatmap by those contributions.

{% hint style="info" %}
With these filters, teams can gain more precise and targeted insights for specific time periods, roles, or activity types.
{% endhint %}

<figure><img src="https://3582076375-files.gitbook.io/~/files/v0/b/gitbook-x-prod.appspot.com/o/spaces%2F-MGIlBSTjQtZxUoFwUx4%2Fuploads%2FG2L0nFndIQtLHR7Azfy0%2Fimage.png?alt=media&#x26;token=fb40c6c8-62e3-476c-8cf4-87458a748cc9" alt="" width="461"><figcaption><p>Module Filters</p></figcaption></figure>

***

### 5. Data Sources

The **Activity Heatmap** module aggregates data from different development tools and contribution types to calculate developer activities.

* **Commits**: Commit records from Git repositories (*Azure DevOps, GitHub, GitLab, Bitbucket, Gitea*)
* **Code Changes**: Lines added, deleted, and modified
* **Pull Requests**: Created PRs (GitHub, GitLab, Bitbucket, Azure Repos, etc.)
* **Code Reviews**: Reviews performed, PR approvals, or rejections
* **Comments**: Comments made on pull requests
* **Developer Profiles**: Only developers defined in Oobeya are included in the analysis

{% hint style="info" %}
Data from these sources is weighted with the coefficients defined in the admin panel and converted into the total score.
{% endhint %}

***

### 6. Recommended Use Cases

The **Activity Heatmap** module can be used in different scenarios to make team activities fairer, more balanced, and more effective:

<table><thead><tr><th width="201.9287109375">Scenario</th><th>Benefit</th></tr></thead><tbody><tr><td><strong>Sprint Reviews</strong></td><td>Analyzes contribution intensity at the end of a sprint, supporting healthier retrospectives.</td></tr><tr><td><strong>Workload Balance</strong></td><td>Identifies overloaded or low-participation team members to rebalance task assignments.</td></tr><tr><td><strong>Engagement &#x26; Motivation</strong></td><td>Helps spot developers with consistently low contributions and supports motivation-boosting actions.</td></tr><tr><td><strong>PR Review Culture</strong></td><td>Measures the review culture of teams through PR reviews, comments, and approvals.</td></tr><tr><td><strong>Performance Improvement</strong></td><td>Tracks collaboration and contribution diversity to uncover training and coaching needs.</td></tr></tbody></table>

{% hint style="info" %}
This module is not only for measuring individual performance but also a powerful team management tool for monitoring **engagement levels** and **workload balance**.
{% endhint %}

***

### 7. FAQ (Frequently Asked Questions)

<details>

<summary>Why are some developers not visible?</summary>

Only developers registered in the Oobeya platform and assigned to active teams are included in the analysis.

</details>

<details>

<summary>How are scores calculated?</summary>

Each activity contribution is multiplied by the coefficients defined in the admin panel. These scores are then normalized daily.

</details>

<details>

<summary>What does the working days filter do?</summary>

It excludes non-working days (such as weekends) from the analysis.

</details>


# Oobeya Release Notes

Check out the newest features and improvements we've just released.

{% hint style="info" %}
We are committed to making [Oobeya](https://oobeya.io) a unique platform for its users. We are constantly adding new features and improvements based on user feedback.
{% endhint %}

## 2024 Release Notes

{% content-ref url="/pages/VWh2VlP3ciIJ3X3ZTA2d" %}
[Oobeya 2024 Q1 - Release Notes](/product/release-notes/oobeya-2024-q1-release-notes)
{% endcontent-ref %}

***

## 2023 Release Notes

{% content-ref url="/pages/Gc9mEqGJut5jDYDkf1DJ" %}
[Oobeya 2023 Q4 - Release Notes](/product/release-notes/oobeya-2023-q4-release-notes)
{% endcontent-ref %}

{% content-ref url="/pages/pbnfKk6nOeM2jdtmF7fK" %}
[Oobeya 2023 Q3 - Release Notes](/product/release-notes/oobeya-2023-q3-release-notes)
{% endcontent-ref %}

{% content-ref url="/pages/0aQKHbqUhIZVOFOH5g0M" %}
[Oobeya 2023 Q2 - Release Notes](/product/release-notes/oobeya-2023-q2-release-notes)
{% endcontent-ref %}

{% content-ref url="/pages/IVBF83ldkrDz4g4nauyV" %}
[Oobeya 2023 Q1 - Release Notes](/product/release-notes/oobeya-2023-q1-release-notes)
{% endcontent-ref %}

***

## 2022 Release Notes

{% content-ref url="/pages/AebIaCAiWOBwrJ1U6bCY" %}
[Oobeya Nov & Dec '22 Updates](/product/release-notes/oobeya-nov-and-dec-22-updates)
{% endcontent-ref %}

{% content-ref url="/pages/HmMTgQeCmKEBDyJade6T" %}
[Oobeya September 2022 Updates](/product/release-notes/oobeya-september-2022-updates)
{% endcontent-ref %}

{% content-ref url="/pages/oTlKnfp7Hl169DCaLaLb" %}
[Oobeya August 2022 Updates](/product/release-notes/oobeya-august-2022-updates)
{% endcontent-ref %}

{% content-ref url="/pages/fHSG7x6ukzZsqIiYIqRt" %}
[Oobeya July 2022 Updates](/product/release-notes/oobeya-july-2022-updates)
{% endcontent-ref %}

{% content-ref url="/pages/J2tEPbiTKY7o2z6N0omb" %}
[Oobeya June 2022 Updates](/product/release-notes/oobeya-june-2022-updates)
{% endcontent-ref %}

{% content-ref url="/pages/vr2omhh1TYEqTDURFBCR" %}
[Oobeya Apr & May 2022 Updates](/product/release-notes/oobeya-apr-and-may-2022-updates)
{% endcontent-ref %}

{% content-ref url="/pages/plv4LpLYWgcTirMLgVnW" %}
[Oobeya March 2022 Updates](/product/release-notes/oobeya-march-2022-updates)
{% endcontent-ref %}

{% content-ref url="/pages/WKIkxqvFbWVi5BS1GuHY" %}
[Oobeya Feb 2022 Updates](/product/release-notes/oobeya-feb-2022-updates)
{% endcontent-ref %}

{% content-ref url="/pages/ZIYrTM76u25o1PvpJCXU" %}
[Oobeya Jan 2022 Updates](/product/release-notes/oobeya-jan-2022-updates)
{% endcontent-ref %}

***

## 2021 Release Notes

{% content-ref url="/pages/-Mch\_vJeKg8YwL30GdKh" %}
[OOBEYA-2.0.4 - Release Notes](/product/release-notes/oobeya-2.0.4)
{% endcontent-ref %}

{% content-ref url="/pages/-MaTAGEdsW2eXFj7cvXs" %}
[OOBEYA-2.0.0](/product/release-notes/oobeya-2.0.0)
{% endcontent-ref %}

{% content-ref url="/pages/-M\_st8t5ivdT6Dk4Brvc" %}
[OOBEYA-1.4.6](/product/release-notes/oobeya-1.4.6)
{% endcontent-ref %}

{% content-ref url="/pages/-MaYrAeZL5bOm7\_Q-\_Rt" %}
[QAD-1.0 - 1.4](/product/release-notes/qad-1.0-1.4)
{% endcontent-ref %}


# Oobeya 2024 Q1 - Release Notes

Check out the new features and improvements we've released for you.

&#x20;:tada: We're thrilled to unveil the latest features and enhancements in [Oobeya](https://oobeya.io)'s 2024 Quarter 1 release! Dive into the exciting new integrations, powerful enhancements, and innovative features designed to elevate your software development and delivery experience.

## ​🎁 NEW FEATURES & IMPROVEMENTS

### **Development Analytics & DORA Metrics**

* **Trunk-based Deployment Analysis**: Introduced support for trunk-based analysis practice within the Oobeya Deployment API, enabling teams to analyze deployments directly from their mainline branches, streamlining deployment tracking and DORA metrics accuracy.
* **Jenkins Integration Enhancements**: Added support for the Multibranch Pipeline projects and the ability to specify job names for CI and CD pipelines separately, enhancing Jenkins integration flexibility for deployment tracking and DORA metrics calculation.<br>

  <figure><img src="https://3582076375-files.gitbook.io/~/files/v0/b/gitbook-x-prod.appspot.com/o/spaces%2F-MGIlBSTjQtZxUoFwUx4%2Fuploads%2F2Krf5if5SeHCUctNgrun%2Fimage.png?alt=media&amp;token=8d872ce8-7b96-4241-9ff7-fb44148ac173" alt=""><figcaption><p>Jenkins DORA Metrics</p></figcaption></figure>
* **Commit Navigation in DORA Deployment Table**: Deployments now include direct links to the commit lists, making it easier to trace changes and review specific commits associated with deployments.
* **Detailed Work Items Tooltip**: The DORA Deployment Table now displays extended details for related work items, including ID, type, title, and creation date, offering a more comprehensive understanding of deployment impacts.

<figure><img src="https://3582076375-files.gitbook.io/~/files/v0/b/gitbook-x-prod.appspot.com/o/spaces%2F-MGIlBSTjQtZxUoFwUx4%2Fuploads%2FZhUZoYgzOEC3jrByAE4R%2Fimage.png?alt=media&amp;token=4b6c36c0-6fa5-4372-a3b2-a556fa0d4038" alt=""><figcaption><p>DORA Deployment list</p></figcaption></figure>

* **Release Strategy Selection**: Users can now select a release strategy (e.g., Long-lived branches, Git Tags, Gitflow release branch pattern) for more precise DORA metric calculations, accommodating various workflow preferences.

<figure><img src="https://3582076375-files.gitbook.io/~/files/v0/b/gitbook-x-prod.appspot.com/o/spaces%2F-MGIlBSTjQtZxUoFwUx4%2Fuploads%2FIJgeuS8kjAOb1YxylcBw%2Fimage.png?alt=media&amp;token=101229da-0b11-46ab-8d7a-157858a68362" alt=""><figcaption><p>Release strategy for DORA Metrics calculation</p></figcaption></figure>

* **Parametric Work Type Calculation**: Introduced a customizable threshold for Git Analytics Work Type Calculation (default: 21 days), allowing teams to define what constitutes each type of work according to their specific processes.

<figure><img src="https://3582076375-files.gitbook.io/~/files/v0/b/gitbook-x-prod.appspot.com/o/spaces%2F-MGIlBSTjQtZxUoFwUx4%2Fuploads%2F7dW7292EutCRxHf0hO3j%2Fimage.png?alt=media&amp;token=f897392f-aa53-494f-8952-c3d4f82a63f1" alt=""><figcaption><p>Git Analytics Work Type</p></figcaption></figure>

### **Symptoms**

* **Unreviewed Pull Requests**: Now shows root causes for the S9 symptom, providing insights into why pull requests may be overlooked, alongside a count of detected root causes for all symptoms, enhancing issue diagnosis.

<figure><img src="https://3582076375-files.gitbook.io/~/files/v0/b/gitbook-x-prod.appspot.com/o/spaces%2F-MGIlBSTjQtZxUoFwUx4%2Fuploads%2F0w8P63m1LEEHBwepHtXy%2Fimage.png?alt=media&amp;token=a1c2173a-d452-4a3b-b9f6-6a1ae6067495" alt=""><figcaption><p>Symptomatic Pull Requests</p></figcaption></figure>

### **UI/UX Enhancements**

* **Enhanced Percentage Display**: For metrics comparison, values greater than 500% are now displayed as "500+%", improving readability for significant changes.

### **Administration**

* **User Activity Tracking**: Enhanced admin features to include analytics on user login patterns, session durations, and more, aiding in understanding and improving user engagement.

<figure><img src="https://3582076375-files.gitbook.io/~/files/v0/b/gitbook-x-prod.appspot.com/o/spaces%2F-MGIlBSTjQtZxUoFwUx4%2Fuploads%2FhOhr3T5knLvHrkyMRhjH%2Fimage.png?alt=media&amp;token=44b3e982-cb53-4895-935c-4a6aed26204c" alt=""><figcaption><p>User analytics</p></figcaption></figure>

* **Team Insights Access Control**: Implemented access restrictions for Team Insights and Analytics, ensuring that team-specific data is only visible to authorized users, enhancing privacy and security.
* **Agile Analytics Enhancements**: Agile boards' analyses are now more secure, automatically hiding from users without explicit board permissions, ensuring sensitive information remains confidential and accessible only to authorized users.
* **Development Analytics Permissions**: Similar to Agile Analytics, any analysis tied to repositories will not be displayed to users lacking the necessary repository permissions, reinforcing data privacy and integrity.

### **Integrations**

* **Appdynamics SaaS Cloud:** Appdynamics' SaaS and on-premises solutions are now fully integrated with Oobeya.
* **Jira Server Enhancements**: Jira Server & Data Center can now connect via API tokens.
* **GitHub App**: Released a dedicated GitHub App to streamline integration and data collection from GitHub repositories, detailed at [Oobeya GitHub Integration](https://docs.oobeya.io/integrations/all-integrations/scm-addons/step-by-step-integration-instructions-for-the-oobeya-github-application).

### **Team Analytics & Agile Analytics**

* Enhanced insights into team performance with features like **Pull Request Comment Count** on the Merged Pull Requests widget.
* **Agile Analytics** improvements include new metrics to track the duration issues stay in a column and the frequency of status reversions (e.g., transitions from test to in progress), offering deeper insights into project flow and efficiency.

We're committed to delivering tools that empower your teams and improve your overall Oobeya experience. If you have any questions or feedback, our support team is ready to assist you. Your feedback is invaluable to our continuous improvement, so we welcome any insights or suggestions you may have.

***

### :person\_running: SEE OOBEYA IN ACTION!

{% hint style="info" %}
Do you want to see all the new features in action and discuss the product roadmap?

Click and [**book a demo**](https://oobeya.io/schedule-a-new-demo/?utm_source=releasenotes\&utm_medium=june2022) now.
{% endhint %}


# Oobeya 2023 Q4 - Release Notes

Check out the new features and improvements we've released for you.

&#x20;:tada: We're thrilled to unveil the latest features and enhancements in [Oobeya](https://oobeya.io)'s Quarter 4 release! Dive into the exciting new integrations, powerful enhancements, and innovative features designed to elevate your software development and delivery experience.

## ​🎁 NEW FEATURES

1. **Gitea Integration**

   * Introducing a new Version Control System tool integration: [Gitea](https://about.gitea.com/). Seamlessly analyze your source code repositories (repos, commits, pull requests) with this latest addition to our integration suite.&#x20;

   <figure><img src="https://3582076375-files.gitbook.io/~/files/v0/b/gitbook-x-prod.appspot.com/o/spaces%2F-MGIlBSTjQtZxUoFwUx4%2Fuploads%2F5nn1djywMMckNEzdRqlO%2Fimage.png?alt=media&amp;token=58922108-1ec7-49e1-bc7e-79906bd19e62" alt=""><figcaption><p>Welcome Gitea! <a href="https://about.gitea.com/">https://about.gitea.com/</a></p></figcaption></figure>
2. **Octopus Deploy Integration for DORA Metrics Tracking**

   * Elevate your CI/CD processes with the new [Octopus Deploy](https://octopus.com/) integration. Effortlessly measure and track DORA Metrics for Octopus Deploy pipelines integrated with any Git-based Version Control System tool.

   <figure><img src="https://3582076375-files.gitbook.io/~/files/v0/b/gitbook-x-prod.appspot.com/o/spaces%2F-MGIlBSTjQtZxUoFwUx4%2Fuploads%2FItG7yBc2ZqZH9HsHqnnN%2Fimage.png?alt=media&amp;token=843c95b0-f41c-43d3-908a-341525daa939" alt="" width="479"><figcaption><p>Gitwiser Analysis Modal</p></figcaption></figure>
3. **AgileSpace Planning Cut-off Days**

   * Empower users to set planning cut-off days for each Scrum board analysis in AgileSpace. Enhance planning accuracy and streamline your Scrum board analysis process.

   <figure><img src="https://3582076375-files.gitbook.io/~/files/v0/b/gitbook-x-prod.appspot.com/o/spaces%2F-MGIlBSTjQtZxUoFwUx4%2Fuploads%2FjC39tAUFglLa1ujjUqwS%2Fimage.png?alt=media&amp;token=2f27a112-5197-4a34-ba16-fe1b0f758ea8" alt=""><figcaption><p>AgileSpace Planning Cut-off Days</p></figcaption></figure>
4. **Time In State Widget Tabs in AgileSpace**

   * Gain deeper insights with new tabs for the Time In State Widget in AgileSpace. Visualize Lead Time Highest 50 and Lead Time Lowest 50 Tasks/Work Items for more comprehensive analytics.

   <figure><img src="https://3582076375-files.gitbook.io/~/files/v0/b/gitbook-x-prod.appspot.com/o/spaces%2F-MGIlBSTjQtZxUoFwUx4%2Fuploads%2F1DAn1mzVARWtWHmQQKPE%2Fimage.png?alt=media&amp;token=1e82da54-d35e-44e5-a3ab-d2333602d7a8" alt=""><figcaption><p>AgileSpace Board Overview</p></figcaption></figure>
5. **DORA Metrics Calculation Enhancements for Bitbucket Server, Cloud, and Jenkins**
   * Extend DORA Metrics support for Bitbucket Server & Cloud users practicing trunk-based development.&#x20;
   * Track SCM Changes information from Jenkins for more accurate DORA metrics calculation.
6. **New DORA Metrics Breakdown Widget for Parent Team Scorecards**

   * Enhance team performance visibility with a new widget in Parent Team Scorecards, displaying DORA Metrics by Team.

   <figure><img src="https://3582076375-files.gitbook.io/~/files/v0/b/gitbook-x-prod.appspot.com/o/spaces%2F-MGIlBSTjQtZxUoFwUx4%2Fuploads%2FTgNhYVQxQ3PepvxV0wHS%2Fimage.png?alt=media&amp;token=5fce4e09-5580-4b18-86cb-d7dd9831916c" alt=""><figcaption><p>DORA Metrics by Team</p></figcaption></figure>
7. **New Symptoms for DORA Metrics**

   * Introducing new symptoms related to DORA Metrics, including High Lead Time For Changes, Low Deployment Frequency, and High Change Failure Rate. Identify and address delivery-related issues proactively.

   <figure><img src="https://3582076375-files.gitbook.io/~/files/v0/b/gitbook-x-prod.appspot.com/o/spaces%2F-MGIlBSTjQtZxUoFwUx4%2Fuploads%2FIrLvDWBVCL6CVhBcjeBR%2Fimage.png?alt=media&amp;token=c3ef2735-55e0-4bb4-bd2a-ad4102b749e4" alt=""><figcaption><p>Oobeya Symptoms for delivery</p></figcaption></figure>

   <figure><img src="https://3582076375-files.gitbook.io/~/files/v0/b/gitbook-x-prod.appspot.com/o/spaces%2F-MGIlBSTjQtZxUoFwUx4%2Fuploads%2F3kG5fc2dzit9SBprcFDw%2Fimage.png?alt=media&amp;token=1463348a-5637-491f-98a3-5fd99b507d77" alt=""><figcaption><p>Symptom Thresholds</p></figcaption></figure>
8. **Azure DevOps Kanban Boards Analysis in AgileSpace**
   * Support for analyzing Azure DevOps Kanban Boards.
9. **GitHub Pull Request Description Parsing for Value Stream Mapping (BETA)**

   * In the BETA version of Value Stream Mapping, Oobeya parses GitHub Pull Request descriptions and identifies related Work Items to track the journey from commit and work item (or issue/task) to Pull Requests to Production Deployments.

   <figure><img src="https://3582076375-files.gitbook.io/~/files/v0/b/gitbook-x-prod.appspot.com/o/spaces%2F-MGIlBSTjQtZxUoFwUx4%2Fuploads%2FNJzixrY4m5698wHjQapU%2Fimage.png?alt=media&amp;token=7c474a9c-f98c-4f91-9ecb-0ac4c750bd6f" alt=""><figcaption><p>Oobeya <strong>Value Stream Mapping (BETA)</strong></p></figcaption></figure>
10. **Select AgileSpace Analysis in Gitwiser Analysis Settings (BETA)**
    * In the BETA version of Value Stream Mapping, users can select the related AgileSpace analysis in Gitwiser analysis settings (only for GitHub right now).
11. **Lead Time Metric Calculation in Value Stream Mapping (BETA)**
    * Calculate a lead time metric in the BETA version of Value Stream Mapping using the formula: Lead Time = Deployment Done - Work Item Created.
12. **Granularity Metric-1 in Team Scorecards (BETA)**

    * In the BETA version of Cognitive Load - Granularity Metrics, calculate a new metric for teams: Granularity Metric -1, with the formula Number of Team Repositories / Number of Team Developers.&#x20;

    <figure><img src="https://3582076375-files.gitbook.io/~/files/v0/b/gitbook-x-prod.appspot.com/o/spaces%2F-MGIlBSTjQtZxUoFwUx4%2Fuploads%2FooHfTZTdpBTByJ66rPYm%2Fimage.png?alt=media&amp;token=ead041f4-9699-4dc6-adc4-8bb150201b1a" alt=""><figcaption><p><strong>Granularity Metric-1</strong></p></figcaption></figure>
13. **New Sprint Velocity Metrics in AgileSpace**

    * These enhancements in AgileSpace include calculating and displaying new metrics in the Sprint Velocity Widget's Last 8 Sprints table, such as Done Planned, Unfinished Planned, Unfinished Effort Pulled in Extra, Predictability, Productivity, Churn, etc.

    <figure><img src="https://3582076375-files.gitbook.io/~/files/v0/b/gitbook-x-prod.appspot.com/o/spaces%2F-MGIlBSTjQtZxUoFwUx4%2Fuploads%2FQa63Xi4UoOzsai8wiI7Q%2Fimage.png?alt=media&amp;token=6d0e9dba-8388-40a3-b8ea-86dec9e6b1f0" alt=""><figcaption><p>Oobeya AgileSpace Board Analytics</p></figcaption></figure>

***

## :muscle: IMPROVEMENTS

* **Performance Improvements in Gitwiser**
  * A new analysis flow for PR & DORA analytics to improve overall performance in Gitwiser.
* **Enhancements in DORA Metrics Calculation**
  * Improvements were made in DORA metrics calculation for more accurate and insightful performance metrics.
* **Slider for DORA Timeline Widgets**
  * Improve data visualization with the addition of a slider to the x-axis of the DORA timeline widgets in Gitwiser.
* **Team Lead Authorization for Gitwiser Repository Analysis**
  * Team Leads are now empowered to update their teams' Gitwiser repository analysis, providing greater autonomy and efficiency.
* **GitHub Workflow ID in Gitwiser**
  * Enhance traceability with the addition of GitHub workflow ID to the Deployment Title in Gitwiser Deployment Analytics (DORA).
* **Merged Pull Request Widget Improvements**
  * Enhance visibility into pull request metrics with improvements to the Merged Pull Request widget, including average coding time and review time.
* **Main Page Improvements in AgileSpace**
  * Experience a more refined AgileSpace main page with improved search, sort, and filter functionalities.
* **Team Lead Authorization for AgileSpace Analysis**
  * Team Leads can now update their teams' AgileSpace analysis, streamlining analysis management.
* **Parallel AgileSpace Board Analysis**
  * Run AgileSpace board analysis in parallel for a more efficient and streamlined analysis process.
* **Display Removal Date for Work Items in AgileSpace**
  * AgileSpace now displays the date when a work item/issue was removed from the sprint, enhancing transparency in sprint reports.
* **Symptoms Threshold and Period Settings**
  * New threshold and period settings for Symptoms, providing greater customization and flexibility.
* **UI/UX Enhancements**
  * Enhance your user experience with various UI improvements, including displaying the license expiration date on the license warning bar and keeping selections in local storage for the hierarchical view of teams.
* **Inactive User Display**
  * Display inactive users and profiles with a distinct style for improved user management and visibility.
* **Value Percentage Display**
  * Show values as 500+% in comparison with the previous period if the value exceeds 500%, offering a more informative visual representation.

We're committed to delivering tools that empower your teams and improve your overall Oobeya experience. If you have any questions or feedback, our support team is ready to assist you. Here's to continued success in your software development journey with Oobeya!

***

## :person\_running: SEE OOBEYA IN ACTION!

{% hint style="info" %}
Do you want to see all the new features in action and talk about the product roadmap?

Click and [**book a demo**](https://oobeya.io/schedule-a-new-demo/?utm_source=releasenotes\&utm_medium=june2022) now.
{% endhint %}


# Oobeya 2023 Q3 - Release Notes

Check out the new features and improvements we've released for you.

&#x20;:tada: Exciting updates and enhancements await you in Oobeya's Quarter 3 release! We've introduced new features and made improvements to enhance your agility and provide valuable insights into your development processes.

## ​🎁 NEW FEATURES

1. **AgileSpace Board Analysis Customization (Jira Cloud/Server, Azure DevOps Boards Cloud/Server)**
   * Tailor your AgileSpace board analysis with customized workflow status mapping and effort field mapping. This feature allows you to adapt AgileSpace to your unique workflow requirements.
2. **AgileSpace & Team Scorecard Relation**
   * Strengthen the connection between AgileSpace and Team Scorecard. This enhancement ensures that AgileSpace data contributes to comprehensive team performance metrics.
3. **Team Scorecard Agile Board Summary Metrics (Scrum and Kanban Boards)**
   * Visualize board summary metrics directly in the Team Scorecard. Gain quick insights into your team's progress and performance without navigating to multiple screens.
4. **Gitwiser Analysis History**
   * View the Gitwiser analysis history to track past analysis duration and health. This feature provides a detailed view of past analyses.
5. **Running and Pending Analyses on Gitwiser's Main Page**
   * Stay informed about the status of your analyses with a quick glance at Gitwiser's main page. Easily track running and pending analyses to keep your development processes on track.
6. **Impact Ratio on Team Scorecard**
   * Measure and track the cognitive load of software developers with the newly introduced Impact Ratio on the Team Scorecard. This metric provides valuable insights into the workload of your development team.
7. **Export Team Scorecard Metrics to Excel**
   * Take your team's metrics with you by exporting Team Scorecard metrics, including development, delivery, and DORA metrics, to an Excel document. This feature enhances flexibility in data analysis and reporting.

***

## :muscle: IMPROVEMENTS

* **Oobeya API Enhancements**
  * Enjoy enhanced capabilities with the Team API and the ability to trigger Gitwiser re-analysis processes through the API. These improvements streamline integration and workflow automation.
* **Oobeya Deployment API Enhancements**
  * Experience a more robust DORA Metrics tracking with enhancements to the Oobeya Deployment API.&#x20;
* **Pull Reqests WIP Widget Enhancements**
  * Display Author, Assignee, and Reviewer columns for the Pull Request Work in Progress (WIP) widget in both Gitwiser and Team Scorecard. This enhancement provides additional context and clarity in your pull request workflows.
* **User List Enhancements**
  * Gain a clearer picture of your user base by showing the total number of users on user lists, including both active and inactive profiles. This enhancement improves user management and visibility.
* **License Limit Tracking on Admin Panel**
  * Keep a close eye on your licensing limits with the new feature that shows available/total values on the Admin Panel. Easily track remaining limits and ensure compliance with licensing agreements.

We're thrilled to deliver these enhancements to empower your teams and improve your overall Oobeya experience. If you have any questions or feedback, our support team is ready to assist you.

***

## :person\_running: SEE OOBEYA IN ACTION!

{% hint style="info" %}
Do you want to see all the new features in action and talk about the product roadmap?

Click and [**book a demo**](https://oobeya.io/schedule-a-new-demo/?utm_source=releasenotes\&utm_medium=june2022) now.
{% endhint %}


# Oobeya 2023 Q2 - Release Notes

Check out the new features and improvements we've released for you.

&#x20;:tada: Exciting updates and improvements await you in Oobeya's Quarter 2 release! We've introduced new features and made enhancements to streamline your workflow and provide a better user experience.

## ​🎁 NEW FEATURES

1. **DORA Metrics for Trunk-Based Development Practices**
   * Oobeya now supports DORA Metrics tracking tailored for trunk-based development practices. Gain deeper insights into your development processes and enhance your team's performance.
2. **Ready-to-Use Oobeya Deployment API**
   * Seamlessly integrate Oobeya with your deployment processes using our newly launched Deployment API. Experience a smoother and more flexible deployment workflow to measure and track your DORA Metrics.
3. **Ready-to-Use Oobeya API**
   * Unlock the full potential of Oobeya with our new API. Easily integrate Oobeya with your existing tools and systems, empowering you to create bulk analysis on Oobeya and extend your reporting capabilities beyond the Oobeya platform.
4. **Symptom Root Cause Identification**
   * Identify the symptomatic units/areas to address issues with Oobeya's Symptoms module. We've enhanced the system to identify and present root causes of symptoms, enabling more effective issue resolution.
5. **Pull Request Revert Rate Metric**
   * Identify reverted pull requests and calculate the Pull Request Revert Rate metric. This valuable insight helps teams assess the effectiveness of their development processes and make data-driven improvements.
6. **DORA Metrics Support for Bitbucket Pipelines**
   * Start tracking your deployments running on Bitbucket Pipelines to measure DORA Metrics. Oobeya now supports Bitbucket Pipelines, providing a comprehensive view of your software development and delivery processes.

***

## :muscle: IMPROVEMENTS

* **Gitwiser Analysis Enhancements**
  * The analysis is now re-analyzed in the new reanalysis period if it failed or has a new commit. Additionally, auto-retry functionality for git, pull request, and deployment analysis has been introduced for a smoother workflow.
* **Performance Enhancements**
  * Experience improved performance across various aspects of Oobeya, including pull request analysis, DORA analysis, and symptom detection.
* **UI/UX Enhancements**
  * Navigate seamlessly to external tools, enjoy design enhancements, and benefit from new descriptions and tooltips. Our UI/UX improvements are designed to enhance your overall Oobeya experience.

We're committed to continuously improving Oobeya to meet your evolving needs. If you have any questions or feedback, our support team is here to assist you. Here's to a more efficient and productive software delivery journey with Oobeya!

***

## :person\_running: SEE OOBEYA IN ACTION!

{% hint style="info" %}
Do you want to see all the new features in action and talk about the product roadmap?

Click and [**book a demo**](https://oobeya.io/schedule-a-new-demo/?utm_source=releasenotes\&utm_medium=june2022) now.
{% endhint %}


# Oobeya 2023 Q1 - Release Notes

Check out the new features and improvements we've released for you.

&#x20;:tada: We are super excited to share our new features and improvements with you!

## ​🎁 NEW FEATURES - TOP 10

1. [Oobeya Team Health \[BETA\] - Autodetected Symptoms](#1-oobeya-team-health-beta-autodetected-symptoms)
2. [Bulk User Import From LDAP](#2-bulk-user-import-from-ldap)
3. [LDAP User Sync Button](#3-ldap-user-sync-button)
4. [Oobeya  OKTA Integration](#4-oobeya-okta-integration)
5. [Oobeya  Veracode Integration](#5-oobeya-veracode-integration)
6. [DORA - Tracking New Relic Incidents](#6-tracking-new-relic-incidents-to-detect-production-failures-automatically-for-dora-metrics-calculat) to Detect Production Failures Automatically for DORA Metrics Calculation
7. [DORA - Identifying Hotfix Naming Patterns ](#7-identifying-hotfix-naming-patterns-to-detect-production-failures-automatically-for-dora-metrics-ca)to Detect Production Failures Automatically for DORA Metrics Calculation
8. [DORA Metrics Trends In A Timeline View](#8-dora-metrics-trends-in-a-timeline-view)
9. [Identifying Reverts and Calculating Pull Request Revert Rate](#9-identifying-reverts-and-calculating-pull-request-revert-rate)
10. [Individual Scorecards Feature on/off Toggle](#10-individual-scorecards-feature-on-off-toggle)

### **#1** Oobeya Team Health \[BETA] - Autodetected Symptoms

The [Oobeya Symptoms](/team-insights-and-symptoms/symptoms-catalog) module is a powerful tool for detecting and addressing problems in software development and delivery processes. By collecting and analyzing data from a variety of sources, the module is able to identify and alert teams to issues such as recurring anti-patterns, bad practices, and bottlenecks.

The Oobeya Symptoms module includes the following features:

* Identification of patterns and trends that may indicate problems or inefficiencies
* Recommendations for addressing detected issues

<table><thead><tr><th width="99.33333333333331">No #</th><th>Smyptom</th><th>Symptom Source</th></tr></thead><tbody><tr><td>S1</td><td><a href="/team-insights-and-symptoms/symptoms-catalog/s1-recurring-high-rework-rate">Recurring high rework rate</a></td><td>Gitwiser - Git Analytics (VCS tools)</td></tr><tr><td>S2</td><td><a href="/team-insights-and-symptoms/symptoms-catalog/s2-recurring-high-cognitive-load">Recurring high cognitive load</a></td><td>Gitwiser - Git Analytics (VCS tools)</td></tr><tr><td>S3</td><td><a href="/team-insights-and-symptoms/symptoms-catalog/s3-high-weekend-activity">High weekend activity</a></td><td>Gitwiser - Git Analytics (VCS tools)</td></tr><tr><td>S6</td><td><a href="/team-insights-and-symptoms/symptoms-catalog/s6-high-technical-debt-on-sonar">High technical debt on Sonar</a></td><td>Sonar</td></tr><tr><td>S7</td><td><a href="/team-insights-and-symptoms/symptoms-catalog/s7-high-vulnerabilities-on-sonar">High vulnerabilities on Sonar</a></td><td>Sonar</td></tr><tr><td>S8</td><td><a href="/team-insights-and-symptoms/symptoms-catalog/s8-high-code-quality-bugs-on-sonar">High code quality bugs on Sonar</a></td><td>Sonar</td></tr><tr><td>S9</td><td><a href="/team-insights-and-symptoms/symptoms-catalog/s9-unreviewed-pull-requests">Unreviewed Pull Requests</a></td><td>Gitwiser - PR Analytics (VCS tools)</td></tr><tr><td>S10</td><td><a href="/team-insights-and-symptoms/symptoms-catalog/s10-lightning-pull-requests">Lightning Pull Requests</a></td><td>Gitwiser - PR Analytics (VCS tools)</td></tr><tr><td>S11</td><td><a href="/team-insights-and-symptoms/symptoms-catalog/s11-oversize-pull-requests">Oversize Pull Requests</a></td><td>Gitwiser - PR Analytics (VCS tools)</td></tr></tbody></table>

#### Oobeya Symptom Catalog

Each symptom includes a description, potential complications, possible causes, improvement areas, and a detection method.&#x20;

<figure><img src="https://3582076375-files.gitbook.io/~/files/v0/b/gitbook-x-prod.appspot.com/o/spaces%2F-MGIlBSTjQtZxUoFwUx4%2Fuploads%2F7hMVNM8kdbGoMO6hXY5e%2Fimage.png?alt=media&amp;token=d08607fb-cafc-4012-9c1e-a6d1863e83ff" alt=""><figcaption><p>Oobeya Symptoms</p></figcaption></figure>

### **#2 Bulk User Import From LDAP**

As an enterprise-grade solution, we understand the importance of providing users with a seamless experience. No matter your organization's size, we know that managing users can be a cumbersome and time-consuming process. That's why we are excited to introduce our new LDAP Bulk User Import feature to manage users easier and faster.&#x20;

The LDAP Bulk User Import feature allows users to quickly import large groups of users into their Oobeya account. This saves time and makes it easier to keep your user base up-to-date. This feature also ensures that user accounts are secure and compliant with your organizational protocols.&#x20;

We hope this feature provides our customers with an improved user experience and helps to reduce the time needed to onboard new users. We are committed to continuing to improve Oobeya and provide our customers with the best possible user experience.&#x20;

If you have any questions about using LDAP Bulk User Import, please reach out to us and one of our team members will be happy to help.

### #3 LDAP User Sync Button

The LDAP User Sync button and functionality allow you to quickly and easily synchronize your user list with your LDAP directory. This means that when a user is deleted from the LDAP directory, her/his account will be deleted (deactivated) from Oobeya automatically. This helps ensure that only valid users have access to your Oobeya system, improving security and reducing the time it takes to maintain your user list.

The best part is that the LDAP User Sync button can be scheduled to run automatically, so you don’t have to worry about manually updating your user list. This is a great time saver for busy administrators and teams.

We hope you enjoy the new LDAP User Sync feature and find it helpful in keeping your user list up-to-date and secure. As always, if you have any questions or feedback, please don’t hesitate to contact us.

### #4 Oobeya OKTA Integration

We’re pleased to announce that Oobeya is now integrated with OKTA! This new feature makes it easier for OKTA users to manage user identity, access, and authentication.

[OKTA](https://www.okta.com/) is a cloud-based identity and access management platform that offers secure single sign-on (SSO) and automated user provisioning. By integrating Oobeya with OKTA, users can now access the system securely and quickly.

The integration with OKTA also provides support for SAML-based authentication. [SAML (Security Assertion Markup Language)](https://developer.okta.com/docs/concepts/saml/) is a popular protocol for web-based SSO that provides a secure way for users to securely access multiple applications with a single set of credentials.

In addition to the improved security, the integration with OKTA streamlines the user experience. With OKTA, users can access Oobeya as other applications with one click. This makes it easier than ever to access the Oobeya platform and manage user identity and authentication.

If you have any questions or need help getting started, don't hesitate to contact our support team.

### **#5 Oobeya Veracode** Integration

We are excited to announce the integration of [Oobeya](https://oobeya.io) with [Veracode](https://www.veracode.com/), a leading application security platform. As a software engineering intelligence platform, we aim to increase the number of our integrations to give our customers more visibility into their software development and delivery cycles.&#x20;

The new integration will provide Oobeya customers with enhanced visibility into their application security posture, allowing them to identify and address security risks quickly and effectively. It will also enable customers to streamline their application security processes.&#x20;

We understand the importance of security and are committed to helping our customers stay ahead of the threats posed by malicious actors. The Veracode integration is the latest step we’re taking to ensure that our customers have the best tools available to protect their applications.&#x20;

<figure><img src="https://3582076375-files.gitbook.io/~/files/v0/b/gitbook-x-prod.appspot.com/o/spaces%2F-MGIlBSTjQtZxUoFwUx4%2Fuploads%2F9HOEljWPN6sMXh3iWgYQ%2Fimage.png?alt=media&amp;token=a229245a-ff19-4c6e-9639-b0cf1aad838e" alt=""><figcaption><p>Oobeya Veracode Integration</p></figcaption></figure>

#### **Oobeya Team Health & Veracode integration**&#x20;

With Oobeya, engineering leaders can get valuable insights into their development teams and improve the developer experience and team health. The Team Health module is designed to address both technical and cultural aspects of the development and delivery processes, providing a holistic approach to optimizing team performance in software development.&#x20;

The Team Health module is comprised of two main components: Team Symptoms and Team Scorecard. Team Symptoms provides a visual representation of team health, highlighting potential areas for improvement and addressing the root causes of team dysfunctions. Team Scorecard, on the other hand, provides a quantitative assessment of team performance, measuring key metrics such as lead time, code review, code quality, and DORA metrics. **Now, + Veracode security metrics!**

{% hint style="info" %}
:bulb: Read more on Oobeya Blog: [Optimizing Team Performance in Software Development with Oobeya Team Health Module](https://oobeya.io/blog/optimizing-team-performance-in-software-development/)
{% endhint %}

### #6 Tracking New Relic Incidents to Detect Production Failures Automatically for DORA Metrics Calculation

We’re excited to announce the release of our newest feature for Oobeya: tracking New Relic incidents to detect production failures automatically for [DORA Metrics](https://oobeya.io/dora-metrics) calculation. With our new feature, customers can quickly and easily track production failures and calculate their Change Failure Rate without any effort.

With Oobeya, you can now connect and track New Relic incidents to detect production failures automatically and more accurately calculate your DORA Metrics, such as the Change Failure Rate (CFR) and Mean Time To Restore Service (MTTR). This new feature helps streamline the process of measuring your DORA Metrics, saving you time and effort.

To get started, simply connect your New Relic account to Oobeya, select your New Relic application in the Gitwiser Deployments (DORA) behind your repository + CICD pipeline, and the rest is taken care of automatically.&#x20;

{% hint style="info" %}
:bulb: Read more on Oobeya Blog: [DORA Metrics Tracking: How to Effectively Detect Production Failures](https://oobeya.io/blog/dora-metrics-tracking-how-to-effectively-detect-production-failures/)
{% endhint %}

### #7 Identifying Hotfix Naming Patterns to Detect Production Failures Automatically for DORA Metrics Calculation

Oobeya can now identify hotfix naming patterns to detect production failures automatically for DORA metrics. With this update, Oobeya can now automatically detect production failures by analyzing your git branch naming conventions.

To identify hotfix deployments, Oobeya looks for naming patterns in the branch name, Pull Request title, and deployment title. Because hotfix deployments are used to fix critical production issues, Oobeya sets the health status of previous deployments to Failure.

This new feature provides teams with an efficient and automated way of tracking their CFR, as well as other DORA metrics.

<figure><img src="https://3582076375-files.gitbook.io/~/files/v0/b/gitbook-x-prod.appspot.com/o/spaces%2F-MGIlBSTjQtZxUoFwUx4%2Fuploads%2FlRmYKq4AEdhx1J4s5Wc5%2Fhotfix-patter.png?alt=media&amp;token=6555ee35-dc2e-4025-b9f3-aa633984b244" alt=""><figcaption><p>Hotfix Pattern Detection</p></figcaption></figure>

### #8 DORA Metrics Trends In A Timeline View

With this new feature, you can now view and compare your team’s performance over time with a timeline that shows trends in your data over time. Through this timeline, you can see how you have improved since the previous version of yourself, and benchmark your progress in comparison. You can view trends over longer periods of time, helping you to make better decisions about where your team needs to go next.

<figure><img src="https://3582076375-files.gitbook.io/~/files/v0/b/gitbook-x-prod.appspot.com/o/spaces%2F-MGIlBSTjQtZxUoFwUx4%2Fuploads%2Fo3X51IsjPQNlN8EIV925%2Fdora-timeline.png?alt=media&amp;token=bd87b289-d249-4b7a-a949-6abbb0da0950" alt=""><figcaption><p>DORA Metrics Trends</p></figcaption></figure>

### #9 Identifying Reverts and Calculating Pull Request Revert Rate

Oobeya's Pull Request Analytics module now can identify pull request reverts and calculate the pull request revert rate at the team level.

This feature is designed to help teams track their development processes more efficiently and accurately. The new feature allows users to track their pull request revert rate, which is a key indicator of the effectiveness of their development process. This helps teams identify areas that need to be improved.

We’re thrilled to offer this new feature to our users and hope it helps them further refine their processes.

### #10 Individual Scorecards Feature on/off Toggle

Oobeya Scorecards allow organizations to gather and track engineering metrics and activities in different dimensions and levels. The Individual Scorecard allows team members to see where they need improvement and identify pending tasks and open issues that require action.&#x20;

On the other hand, we know some organizations do not prefer to make metrics and activities visible at the individual level. Administrators can enable or disable Individual Scorecards for their organizations by using this toggle. By accessing the Oobeya admin panel, admins now have the ability to toggle the individual scorecards feature on and off, giving them the flexibility to customize their experience with the platform.

<figure><img src="https://3582076375-files.gitbook.io/~/files/v0/b/gitbook-x-prod.appspot.com/o/spaces%2F-MGIlBSTjQtZxUoFwUx4%2Fuploads%2FdxgILeWXD5CG4WrWmXxs%2Fimage.png?alt=media&amp;token=f5892f60-ae48-4e77-8502-65a77cd053f0" alt=""><figcaption></figcaption></figure>

## :muscle: IMPROVEMENTS

* \[Gitwiser] Started to show the list of the running/pending/cloning analyses.
* \[TeamScorecard] Added a technology/language filter for code quality (Sonarqube, SonarCloud) widgets.
* \[TeamScorecard] Added multiple data source selection functionality for Sonar addon.
* \[Admin] Added a "Test Connection" button to the LDAP configuration page.
* Performance improvements (Pull request analysis, DORA analysis, Symptom detection, and more...)
* UI/UX improvements (navigating to external tools, design enhancements, new descriptions and tooltips, and more...)

## :person\_running: SEE OOBEYA IN ACTION!

{% hint style="info" %}
Do you want to see all the new features in action and talk about the product roadmap?

Click and [**book a demo**](https://oobeya.io/schedule-a-new-demo/?utm_source=releasenotes\&utm_medium=june2022) now.
{% endhint %}


# Oobeya Nov & Dec '22 Updates

Check out the new features and improvements we've released for you.

## SUMMARY

&#x20;:tada: We are super excited to share our new features and improvements with you!

* [x] **DORA** - **Azure DevOps** [**Pipelines**](https://azure.microsoft.com/en-us/products/devops/pipelines/) integration is now available in Oobeya Deployment Analytics! You can use this feature to track DORA metrics in an accurate and effortless way. With this feature, Oobeya now supports both Azure Pipelines and Releases!
* [x] **DORA** - Oobeya Deployment Analytics now has **a new automated failure detection** feature that allows you to detect failures **by Git branch** **and** **Deployment title naming patterns**!
* [x] **DORA** - Oobeya Deployment Analytics now has **a new automated failure detection** feature that allows you to detect failures **by** [**New Relic**](https://newrelic.com/platform/alerts) **Incidents & Alerts**!
* [x] Gitwiser Git Analytics now allows you to **filter results by Team**!
* [x] We started to display the **historical timeline** of the Efficient Development Ratio!
* [x] In the Team Scorecard configuration, we've added a new suggestion feature that automatically selects deployments based on the selected repositories.
* [x] The Gitwiser module now displays the icon of the analyzed VCS add-on.
* [x] The [**Testinium**](https://testinium.com) **Add-on** has two new widgets: Success Rate & Average Runtime.


# Oobeya September 2022 Updates

Check out the new features and improvements we've released for you.

## SUMMARY

&#x20;:tada: We are super excited to share our new features and improvements with you!

* [x] New Datepicker design and functionalities are ready to use!
* [x] Pull Request Metrics Highlights in Gitwiser
* [x] Performance Improvements
* [x] UI/UX Improvements

## :person\_running: SEE OOBEYA IN ACTION!

{% hint style="info" %}
Do you want to see all the new features in action and talk about the product roadmap?

Click and [**book a demo**](https://oobeya.io/schedule-a-new-demo/?utm_source=releasenotes\&utm_medium=june2022) now.
{% endhint %}


# Oobeya August 2022 Updates

Check out the new features and improvements we've released for you.

## SUMMARY

&#x20;:tada: We are super excited to share our new features and improvements with you!

* [x] TeamCity integration is ready! Calculate and track TeamCity DORA metrics!
* [x] Oobeya Dashboard DORA Metrics Widget now displays all DORA Metrics!
* [x] Exclude deployments to calculate DORA Metrics more accurately!
* [x] Select Gitwiser analysis period to optimize analysis performance
* [x] New Pull Request metrics are ready to use! Improve your teams' code review cycles.
* [x] Manage Team Members easily!

## ​🎁 NEW FEATURES

### Oobeya TeamCity integration is ready!

If you're using TeamCity for your CI/CD needs, we have some great news for you - the Oobeya TeamCity integration is now available!

You can now calculate and track your TeamCity DORA metrics seamlessly; we think it's a great way to improve your CI/CD process.&#x20;

<figure><img src="https://3582076375-files.gitbook.io/~/files/v0/b/gitbook-x-prod.appspot.com/o/spaces%2F-MGIlBSTjQtZxUoFwUx4%2Fuploads%2Fy4AdNbAhPqSQ3weEf8R0%2Fimage.png?alt=media&amp;token=c7428b43-189a-4da4-8468-f8284c2550bc" alt=""><figcaption><p>TeamCity Addon</p></figcaption></figure>

To get started, simply head over to our [Marketplace](/integrations/adding-new-integration/installing-an-addon) page and activate the TeamCity addon. Then, [add your TeamCity data source](/integrations/adding-new-integration/adding-a-new-data-source). Once you have it set up and started [Oobeya Deployment Analytics](/deployment-analytics/dora-metrics-introduction), you'll be able to see your DORA metrics in Oobeya.

{% hint style="info" %}
:bulb: Read more on Oobeya Blog: [TeamCity Integration Is Ready!](https://oobeya.io/blog/github-enterprise-server-integration-is-ready/)
{% endhint %}

{% hint style="info" %}
***Oobeya Deployment Analytics*** works with [GitLab CI](/integrations/all-integrations/scm-addons/gitlab-addon), [AzureDevOps](/integrations/all-integrations/scm-addons/azure-devops-integration), [Jenkins](/integrations/all-integrations/scm-addons/jenkins-integration), [GitHub Actions](/integrations/all-integrations/scm-addons/github-integrations), and TeamCity for now.&#x20;

Coming soon: *Spinnaker, BB Pipelines, Octopus, PagerDuty, OpsGenie, ServiceNow,* and more...
{% endhint %}

<figure><img src="https://3582076375-files.gitbook.io/~/files/v0/b/gitbook-x-prod.appspot.com/o/spaces%2F-MGIlBSTjQtZxUoFwUx4%2Fuploads%2FdoiS5GPmsvyKuYmMR0Aj%2Fimage.png?alt=media&amp;token=ba1564ee-f345-46da-8d33-b5fe6f9ae24c" alt=""><figcaption><p>Oobeya calculates DORA Metrics for TeamCity Pipelines</p></figcaption></figure>

### Oobeya Team Scorecards now display all DORA Metrics!

We are excited to announce that the Oobeya Dashboard "**DORA Metrics Widget**" now displays all [four DORA Metrics](https://oobeya.io/dora-metrics-four-key/)! This improvement makes it easy to track your progress against the four key indicators of the DevOps Performance Framework: Lead Time For Changes, Deployment Frequency, Change Failure Rate, and Mean Time to Restore Service.

<figure><img src="https://3582076375-files.gitbook.io/~/files/v0/b/gitbook-x-prod.appspot.com/o/spaces%2F-MGIlBSTjQtZxUoFwUx4%2Fuploads%2Fee0aSQZ0pBl4cTBfTVhk%2Fimage.png?alt=media&amp;token=2bca5c08-4292-47b3-97d5-11b04dd548bd" alt=""><figcaption><p>Oobeya DORA Metrics Widget</p></figcaption></figure>

To access the DORA Metrics Widget, simply go to your [Dashboard](/dashboards/creating-a-new-dashboard) and [click on the "Widgets"](/dashboards/adding-a-new-widget) button in the top right corner. From Gitwiser > Deployment Analytics, you can add the DORA Metrics Widget to your Dashboard.

We hope you find this new feature helpful in tracking your DORA Metrics!

### Exclude deployments to calculate DORA Metrics more accurately!

We're excited to announce a new feature for Oobeya Deployment Analytics - the ability to exclude deployments from your [DORA Metrics](https://oobeya.io/dora-metrics-four-key/) calculations!

Previously, when calculating your Lead Time For Changes, any deployments that were considered anomalies would be included in the calculation. This could lead to inaccurate results and made it difficult to get an accurate picture of your development and delivery process.

Now, with the new deployment exclusion feature, Oobeya automatically excludes any deployments that are considered anomalies. Oobeya users are also able to exclude any deployment manually.

This will give you a more accurate picture of your delivery process and help you identify and fix any issues more effectively.

We hope you find this new feature helpful! As always, if you have any questions or feedback, please don't hesitate to reach out to us.

<figure><img src="https://3582076375-files.gitbook.io/~/files/v0/b/gitbook-x-prod.appspot.com/o/spaces%2F-MGIlBSTjQtZxUoFwUx4%2Fuploads%2Fgur00EiBnmFYspc4aAmq%2Fimage.png?alt=media&amp;token=ed13653b-4a9c-461b-a274-73534fdbbef5" alt=""><figcaption></figcaption></figure>

### Select Gitwiser analysis period to optimize analysis performance

We are excited to announce a new feature for [Oobeya](https://oobeya.io/) - the ability to select the analysis period to optimize performance.

Gitwiser is a powerful git analytics tool that lets development teams see the impact and cognitive load of commits on the team average. It's been a valuable tool for development teams and leaders looking to improve their workflow and optimize their working practices.

With this new feature, you can select the period of time you want to analyze to get the most accurate results. This is especially **helpful for large projects with a lot of history**.

<figure><img src="https://3582076375-files.gitbook.io/~/files/v0/b/gitbook-x-prod.appspot.com/o/spaces%2F-MGIlBSTjQtZxUoFwUx4%2Fuploads%2F7IkhdgMnNtUIg3naEKHw%2Fimage.png?alt=media&amp;token=1b227501-1a47-47cc-a71d-812076b1098d" alt=""><figcaption></figcaption></figure>

See the other features below to optimize Gitwiser analysis performance:

* Commit Exclusions
* Source Code File and Folder Exclusions (exclusion patterns)

### New Key Pull Request metrics are ready to use! Improve your teams' code review cycles!

We've just released a new set of metrics for the Oobeya Pull Request Analytics module:&#x20;

* **Avg Time To Merge:** The time elapsed between the first commit and merge time.
* **% PRs Merged Within Goal:** The percentage of merged pull requests within the specified team goal.

These key metrics will help you improve your team's code review cycles and performance.

<figure><img src="https://3582076375-files.gitbook.io/~/files/v0/b/gitbook-x-prod.appspot.com/o/spaces%2F-MGIlBSTjQtZxUoFwUx4%2Fuploads%2FquSIBRFHdToBBvkMcTP8%2Fimage.png?alt=media&amp;token=36a76490-14ca-4095-881a-a6450716d467" alt=""><figcaption><p>Key pull request metrics</p></figcaption></figure>

### Manage Team Members easily!

Oobeya is excited to announce this new feature to help team leads manage their team members easily! With this new feature, team leads can add and remove members with ease, as well as receive smart suggestions on who to add or remove to their team.&#x20;

This new feature is designed to make managing teams easier and more efficient for Oobeya users.

## :muscle: IMPROVEMENTS

* \[Gitwiser] GitHub API Rate Limit improvements
* \[Gitwiser] Bitbucket API Rate Limit improvements
* Performance improvements
* UI/UX improvements (on time in state widget, team search, date filter, and more...)

## :person\_running: SEE OOBEYA IN ACTION!

{% hint style="info" %}
Do you want to see all the new features in action and talk about the product roadmap?

Click and [**book a demo**](https://oobeya.io/schedule-a-new-demo/?utm_source=releasenotes\&utm_medium=june2022) now.
{% endhint %}


# Oobeya July 2022 Updates

Check out the new features and improvements we've released for you.

## Summary

&#x20;:tada: We are super excited to share our new features and improvements with you!

* [x] GitHub Enterprise Server integration is ready!
* [x] Oobeya Team Scorecards now display all DORA Metrics!
* [x] DORA Metrics widgets now have a date range comparison feature! (Last 7 days vs. Previous 7 days)
* [x] Oobeya Agile Board Analytics module has a date range comparison feature!
* [x] Oobeya Agile Sprint Reports has a new comparison feature! (Sprint 25 vs. Last 10 Sprints Avg)
* [x] UI/UX & performance improvements!

## ​🎁 NEW FEATURES

### GitHub Enterprise Server integration is ready!

We’re excited to announce that Oobeya now integrates with GitHub Enterprise Server! This new addon is available in our marketplace, and we’ve created a quick start guide to help you get started.

![](https://3582076375-files.gitbook.io/~/files/v0/b/gitbook-x-prod.appspot.com/o/spaces%2F-MGIlBSTjQtZxUoFwUx4%2Fuploads%2FcpJ8rqqXnolMnLVvIcY0%2Fimage.png?alt=media\&token=acc85ac6-59ff-4ea6-b395-cd75ebb5d899)

This integration enables Oobeya to be used with GitHub Enterprise Server, in addition to our already existing [GitHub](https://docs.oobeya.io/integrations/scm-addons/github-integrations) and [GitHub Enterprise Cloud](https://docs.oobeya.io/integrations/scm-addons/github-integrations) integrations.

[GitHub Enterprise Server](https://docs.github.com/en/enterprise-server@3.5/admin/overview/about-github-enterprise-server) is the on-premises version of [GitHub](https://github.com/), and we’re thrilled to offer this new integration to our users. With this new addon, you can easily connect [Oobeya](https://oobeya.io/integrations/) to your GitHub Enterprise Server instance.

{% hint style="info" %}
:bulb: Read more on Oobeya Blog: [GitHub Enterprise Server Integration Is Ready!](https://oobeya.io/blog/github-enterprise-server-integration-is-ready/)-
{% endhint %}

<details>

<summary>How Does Oobeya GitHub Integration Work?</summary>

Oobeya GitHub addon collects and analyzes data/activities/signals from GitHub and makes sense of them in multiple dimensions (individual, team, organization, system). It provides actionable insights to software engineering teams and leaders.&#x20;

This integration works with the following Oobeya analytics modules:

1. Git Repository Analytics **(Software Development Process)**
2. Pull Requests Analytics **(Code Review Process)**
3. Deployment Analytics – DORA Metrics **(Software Delivery Process)** (works with GitHub Actions, Jenkins, Azure DevOps, GitLabCI, TeamCity)

See the Software Engineering Metrics that Oobeya delivers [here](https://oobeya.io/oobeya-metric-definitions/).

</details>

{% hint style="info" %}
***Oobeya Deployment Analytics*** works with [GitLab CI](/integrations/all-integrations/scm-addons/gitlab-addon), [AzureDevOps](/integrations/all-integrations/scm-addons/azure-devops-integration), [Jenkins](/integrations/all-integrations/scm-addons/jenkins-integration), and [GitHub Actions](/integrations/all-integrations/scm-addons/github-integrations) for now.&#x20;

Coming soon: *Spinnaker, BB Pipelines, Octopus, PagerDuty, OpsGenie, ServiceNow,* and more...
{% endhint %}

### Oobeya Team Scorecards now display all DORA Metrics!

Oobeya Team Scorecards now display all four DORA Metrics: Lead Time For Changes, Deployment Frequency, Change/Failure Rate, and Time To Restore Service!

This means that teams can now track their progress against each of these important engineering metrics, and identify areas where they may need to focus their improvement efforts.

You can also drill down into each metric to see how your teams are doing. This is a great way to stay on top of your team's delivery performance and make sure that you're always improving.

![DORA Metrics on Team Scorecards](https://3582076375-files.gitbook.io/~/files/v0/b/gitbook-x-prod.appspot.com/o/spaces%2F-MGIlBSTjQtZxUoFwUx4%2Fuploads%2FfLtp4todHtlE7euausZ2%2Foobeya-deployment-dora-metrics.png?alt=media\&token=8a3bc750-7433-41f5-bf10-b33351d0b867)

We hope that this new feature will help teams to better understand their performance and continue to drive quality improvements in their engineering processes.

### DORA Metrics widgets now have a date range comparison feature!

DORA Metrics widgets now have a date range comparison feature! This means that you can now compare your current performance against a previous time period, and see how you're progressing. (for example, Last 7 days vs. Previous 7 days)

This new feature allows you to benchmark your progress and compare it against a date range of your choosing. This is a great tool for continuous improvement.&#x20;

We hope you find this new feature helpful!

### Oobeya Agile Board Analytics module has a date range comparison feature!

Oobeya Agile Board Analytics module has a date range comparison feature! This new feature will allow agile team members to compare the agile metrics across different time periods. This will help with continuous improvement by allowing Scrum Masters and Product Owners to see where their team's sprint success has improved or worsened.

![Agile Board Overview - Time in State widget with date range comprasion](https://3582076375-files.gitbook.io/~/files/v0/b/gitbook-x-prod.appspot.com/o/spaces%2F-MGIlBSTjQtZxUoFwUx4%2Fuploads%2FRv3UExNcnd5Nf5f4jJD1%2Fimage.png?alt=media\&token=252866db-4e5e-4ae9-aee9-cdeb5197ae48)

### Oobeya Agile Sprint Reports has a new comparison feature!&#x20;

The Oobeya Agile Sprint Reports has a new comparison feature! This new feature will allow Product Owners to compare their sprint success against other sprints and benchmark their progress. This will help ensure that Product Owners are always aware of their sprint progress and can make necessary adjustments to ensure sprint success.

To use the comparison feature, simply select the sprints that you want to compare from the drop-down menu. You will then see the comparison of the selected sprints. This will allow you to quickly see how your team is progressing.

We hope that you find this new feature helpful in achieving your sprint goals.

![Agile Sprint Reports - Sprint Comparison](https://3582076375-files.gitbook.io/~/files/v0/b/gitbook-x-prod.appspot.com/o/spaces%2F-MGIlBSTjQtZxUoFwUx4%2Fuploads%2FumbC3deYY2hsTsJUyNkq%2Fimage.png?alt=media\&token=ccbd026e-7233-484f-85d9-c117bd3be347)

## :muscle: IMPROVEMENTS

* \[Gitwiser] Do not analyze a commit if it has already been analyzed in another branch analysis.
* \[Gitwiser] Allow limiting Gitwiser analysis by date to improve analysis performance.
* Performance improvements
* UI/UX improvements

## :person\_running: SEE OOBEYA IN ACTION!

{% hint style="info" %}
Do you want to see all the new features in action and talk about the product roadmap?

Click and [**book a demo**](https://oobeya.io/schedule-a-new-demo/?utm_source=releasenotes\&utm_medium=june2022) now.
{% endhint %}


# Oobeya June 2022 Updates

Check out the new features and improvements we've released for you.

## Summary

&#x20;:tada: We are super excited to introduce you to our new features and improvements!

* [x] DORA Stability Metrics -1: [Change Failure Rate](#dora-stability-metrics-1-change-failure-rate)
* [x] DORA Stability Metrics -2: [Time to Restore Service](#dora-stability-metrics-2-time-to-restore-service)
* [x] [Executive View & Organization-Wide Metrics](#executive-view-and-organization-wide-metrics)
* [x] [Improvements](#improvements) on AgileSpace, Gitwiser, Sonarqube, and UI/UX
* [x] Private Beta: [Symptoms ](#private-beta-cooking-something-special)(cooking something special...)

## ​🎁 NEW FEATURES

### DORA Stability Metrics -1: Change Failure Rate

We have added Change Failure Rate to Oobeya Deployment Analytics \[BETA]!&#x20;

{% hint style="info" %}
**Change Failure Rate:** The percentage of deployments causing a failure in production.

:bulb: Read more on Oobeya Blog: [How to Measure DORA Metrics Accurately?](https://oobeya.io/blog/how-to-measure-dora-metrics-accurately/)
{% endhint %}

You can set your deployment status as a failure manually now.&#x20;

![Setting deployment health status and fix deployment manually](https://3582076375-files.gitbook.io/~/files/v0/b/gitbook-x-prod.appspot.com/o/spaces%2F-MGIlBSTjQtZxUoFwUx4%2Fuploads%2F6xAPgxUKxPAtUPOxIYse%2Fimage.png?alt=media\&token=09ea026c-f431-4644-aafc-923a6ef29ba0)

In the next release, deployment failures will be detected automatically by **Git tags** and **branch names**.

![DORA Metrics - Change Failure Rate](https://3582076375-files.gitbook.io/~/files/v0/b/gitbook-x-prod.appspot.com/o/spaces%2F-MGIlBSTjQtZxUoFwUx4%2Fuploads%2FugbiXBar3bzX7H7V1CBI%2Fimage.png?alt=media\&token=09f0b064-51ab-4d30-b684-31dc3c922f31)

<details>

<summary>Best tool to track DORA metrics: <strong>Why Oobeya Deployment Analytics?</strong></summary>

* Proven Metrics ([DevOps Research & Assessment](https://www.devops-research.com/))
* Quick Start (Measuring DORA metrics [has never been easier](https://www.youtube.com/watch?v=EYE4e1gTs80))
* Cross-Platform Analysis (SCM x CI/CD x APM)
* Accurate Results :white\_check\_mark:

**Discover DORA Metrics** with Oobeya: [https://oobeya.io/dora-metrics](https://oobeya.io/dora-metrics/)

Read more on Oobeya Blog: [How to Measure DORA Metrics Accurately?](https://oobeya.io/blog/how-to-measure-dora-metrics-accurately/)

</details>

{% hint style="info" %}
***Oobeya Deployment Analytics*** works with [GitLab CI](/integrations/all-integrations/scm-addons/gitlab-addon), [AzureDevOps](/integrations/all-integrations/scm-addons/azure-devops-integration), [Jenkins](/integrations/all-integrations/scm-addons/jenkins-integration), and [GitHub Actions](/integrations/all-integrations/scm-addons/github-integrations) for now.&#x20;

Coming soon: *Spinnaker, BB Pipelines, Octopus, PagerDuty, OpsGenie, ServiceNow,* and more...
{% endhint %}

### DORA Stability Metrics -2: **Time to Restore Service**

We have added the Time to Restore Service / Mean Time To Recovery (MTTR) metric to Oobeya Deployment Analytics \[BETA]!&#x20;

{% hint style="info" %}
**Time to Restore Service:** How long it takes an organization to recover from a failure in production.

:bulb: Read more on Oobeya Blog: [How to Measure DORA Metrics Accurately?](https://oobeya.io/blog/how-to-measure-dora-metrics-accurately/)
{% endhint %}

![DORA Metrics - Mean Time To Recovery (MTTR)](https://3582076375-files.gitbook.io/~/files/v0/b/gitbook-x-prod.appspot.com/o/spaces%2F-MGIlBSTjQtZxUoFwUx4%2Fuploads%2FAhimVyf5X2CW8eHPNqpD%2Fimage.png?alt=media\&token=a883e411-aa1c-49b1-b151-9366d0707105)

### Executive View & Organization-Wide Metrics

You can set your own Organization Schema to create a hierarchical view in Oobeya.

![You can set your own Organization Schema to create a hierarchical view.](https://3582076375-files.gitbook.io/~/files/v0/b/gitbook-x-prod.appspot.com/o/spaces%2F-MGIlBSTjQtZxUoFwUx4%2Fuploads%2FmsNlPwgZZR9fA4XUwCpX%2Fimage.png?alt=media\&token=09e57844-14b4-44e7-92b6-4de4b7ac6c44)

After you create your organization chart, you can view your organization-wide metrics with breakdowns. All the metrics shown will be customizable in this view.

![Organization-wide metrics along with breakdowns](https://3582076375-files.gitbook.io/~/files/v0/b/gitbook-x-prod.appspot.com/o/spaces%2F-MGIlBSTjQtZxUoFwUx4%2Fuploads%2F4vCbnKTJKXNAwuB60jhk%2Fimage.png?alt=media\&token=6a2779f5-b40f-4c12-bf25-65b971bf1dee)

## :muscle: IMPROVEMENTS

* \[AgileSpace] Added Total Story Points & Total Issue Count value to Sprint Reports
* \[AgileSpace] Added a new tab to Sprint Velocity Metrics widget: "Team Members”
* \[AgileSpace] Added task dropdown to Scope Changes widget
* \[AgileSpace] Added a new configuration option for Azure DevOps Story Points / Effort fields
* \[Gitwiser] Added automated-reanalyze feature for Pull Request Analysis
* \[Sonarqube] Started hiding Sonarqube issues which are set as "won't fix" on Sonarqube
* Performance improvements
* UI/UX improvements

## :lock: **PRIVATE BETA - Cooking something special**

We are currently working on a new module called "**Symptoms**".&#x20;

Oobeya ***Symptoms*** module identifies automatically symptoms of software development and delivery processes.

20+ symptoms are ready-to-use and auto-detect unhealthy practices of dev teams in private beta.

| Symptoms of software development and delivery processes | Tags                                             |
| ------------------------------------------------------- | ------------------------------------------------ |
| Recurring high rework rate                              | low\_efficiency, slow\_delivery, dissatisfaction |
| Recurring high cognitive load                           | burnout\_risk, high\_workload, bad\_planning     |
| High weekend activity                                   | burnout\_risk, bad\_planning                     |
| High active coding days (%80+)                          | burnout\_risk                                    |
| Work on X+ repos in a selected period                   | interruption, burnout\_risk                      |
| High technical debt on Sonarqube                        | quality\_risk, dissatisfaction                   |
| High vulnerabilities on Sonarqube                       | quality\_risk, security\_risk                    |
| High code quality bugs on Sonarqube                     | quality\_risk                                    |
| Unreviewed Pull Requests                                | quality\_risk, unreviewed\_pr                    |
| Lightning Pull Requests                                 | quality\_risk, unreviewed\_pr                    |
| Oversized Pull Requests                                 | quality\_risk, bottleneck, large\_deploy\_risk   |
| High Pull Request review time                           | slow\_delivery                                   |
| Reviewer bottleneck %                                   | slow\_delivery, bottleneck, high\_workload       |
| High cycle time (tasks)                                 | slow\_delivery, dissatisfaction, bottleneck      |
| High lead time (tasks)                                  | slow\_delivery                                   |
| Low sprint planning accuracy                            | slow\_delivery, dissatisfaction                  |
| Low sprint delivery rate                                | low\_efficiency, slow\_delivery, dissatisfaction |
| Tasks in progress                                       | burnout\_risk, high\_workload, bad\_planning     |
| Recurring high scope changes                            | low\_efficiency, dissatisfaction, interruption   |
| High Lead Time For Changes                              | slow\_delivery                                   |
| High Deploy Duration                                    | slow\_delivery                                   |
| Low Deploy Frequency                                    | slow\_delivery, large\_deploy\_risk              |

## :person\_running: SEE OOBEYA IN ACTION!

{% hint style="info" %}
Do you want to see all the new features in action and talk about the product roadmap?

Click and [**book a demo**](https://oobeya.io/schedule-a-new-demo/?utm_source=releasenotes\&utm_medium=june2022) now.
{% endhint %}


# Oobeya Apr & May 2022 Updates

Check out the new features and improvements we've released for you.

## ​​🎁 New **Features**

### Deployment Analytics (DORA Metrics) - GITHUB ACTIONS Integration

Oobeya Deployment Analytics now works with [GitHub Actions](/integrations/all-integrations/scm-addons/github-integrations). If you have a **\[Git Repo X GitHub Actions]** pipeline configured, you can calculate [DORA metrics](https://oobeya.io/dora-metrics/) by using Oobeya.

<details>

<summary>Best tool to track DORA metrics: <strong>Why Oobeya Deployment Analytics?</strong></summary>

* Proven Metrics ([DevOps Research & Assessment](https://www.devops-research.com/))
* Quick Start (Measuring DORA metrics [has never been easier](https://www.youtube.com/watch?v=EYE4e1gTs80))
* Cross-Platform Analysis (SCM x CI/CD x APM)
* Accurate Results :white\_check\_mark:

**Discover DORA Metrics** with Oobeya: [https://oobeya.io/dora-metrics](https://oobeya.io/dora-metrics/)

</details>

{% hint style="info" %}
***Oobeya Deployment Analytics*** works with [GitLab CI](/integrations/all-integrations/scm-addons/gitlab-addon), [AzureDevOps](/integrations/all-integrations/scm-addons/azure-devops-integration), [Jenkins](/integrations/all-integrations/scm-addons/jenkins-integration), and [GitHub Actions](/integrations/all-integrations/scm-addons/github-integrations) for now.&#x20;

Coming soon: *Spinnaker, BB Pipelines, Octopus,* and more...
{% endhint %}

### New Dashboard Widget: DORA METRICS

We've developed a new widget to show [DORA Metrics](https://oobeya.io/dora-metrics) on our customizable Dashboards. You can now add DORA Metrics widget to your Dashboards by clicking "New Widget > Oobeya Widgets / Gitwiser".

![Oobeya Dashboards - DORA Metrics Widget](https://3582076375-files.gitbook.io/~/files/v0/b/gitbook-x-prod.appspot.com/o/spaces%2F-MGIlBSTjQtZxUoFwUx4%2Fuploads%2Fzgg9KECJONzq2OUTSWRV%2Fimage.png?alt=media\&token=a81180a9-1e74-4e4c-a1ec-afef419bced8)

## :muscle: Improvements

* AgileSpace - Azure DevOps Time To Market metric calculation (created to deployed)
* Added “Delivered Story Points” column to Sprint Assignee table
* Added Issue Type filter for AgileSpace widgets
* Performance improvements
* UI/UX improvements.


# Oobeya March 2022 Updates

Check out the new features and improvements we've released for you.

## Summary

:tada: We are super excited to introduce our new features and improvements.

* [x] \[BETA] Deployment Analytics (DA) - [DORA Metrics](https://oobeya.io/dora-metrics/)
* [x] DA - Jenkins Integration
* [x] DA - Git Release Integration
* [x] DA - Team Goals
* [x] DA - Automated Reanalyze
* [x] DA - Time Period Comparison
* [x] DA - Deploy Size
* [x] DA - [DORA Metrics](https://oobeya.io/dora-metrics/) on Team Scorecards
* [x] Gitwiser Active Analytics Types
* [x] AgileSpace Reset Analysis
* [x] Download System Logs

## :beginner: \[BETA] Deployment Analytics (DORA Metrics)&#x20;

Calculating [DORA metrics](https://oobeya.io/dora-metrics/) is not easy. We're still working on the Deployment Analytics module so that teams can effortlessly track accurate [DORA metrics](https://oobeya.io/dora-metrics/) calculated by Oobeya.

<details>

<summary>Best tool to track DORA metrics: <strong>Why Oobeya Deployment Analytics?</strong></summary>

* Proven Metrics ([DevOps Research & Assessment](https://www.devops-research.com/))
* Quick Start (Measuring DORA metrics [has never been easier](https://www.youtube.com/watch?v=EYE4e1gTs80))
* Cross-Platform Analysis (SCM x CI/CD x APM)
* Accurate Results :white\_check\_mark:

**Discover DORA Metrics** with Oobeya: [https://oobeya.io/dora-metrics](https://oobeya.io/dora-metrics/)

</details>

{% hint style="info" %}
***Oobeya Deployment Analytics*** works with [GitLab CI](/integrations/all-integrations/scm-addons/gitlab-addon), [AzureDevOps](/integrations/all-integrations/scm-addons/azure-devops-integration), [Jenkins](/integrations/all-integrations/scm-addons/jenkins-integration) for now.&#x20;

Coming soon: *GitHub Actions, Spinnaker, BB Pipelines, Octopus,* and more...
{% endhint %}

## :electric\_plug: New Integrations

#### 1- Deployment Analytics (DORA metrics) - Jenkins Integration

Oobeya Deployment Analytics now works with [Jenkins](/integrations/all-integrations/scm-addons/jenkins-integration). If you have a **\[Git Repo X Jenkins]** pipeline configured, you can calculate [DORA metrics](https://oobeya.io/dora-metrics/) by using Oobeya.

![GitLab-GitHub-Bitbucket-AzureDevOps X Jenkins](https://3582076375-files.gitbook.io/~/files/v0/b/gitbook-x-prod.appspot.com/o/spaces%2F-MGIlBSTjQtZxUoFwUx4%2Fuploads%2FajoHszLnFHncOcWhhoZQ%2Fdora-jenkins.gif?alt=media\&token=20a3575f-1a12-402e-b9eb-5fd435965ba1)

#### 2- Deployment Analytics (DORA metrics) - Git Release

**Calculate DORA metrics without pipeline configuration (Git Release)**

Oobeya Deployment Analytics now works without any CI/CD pipeline integration. You can calculate DORA metrics just by selecting the git branch your team released.

![Select the git branch your team released](https://3582076375-files.gitbook.io/~/files/v0/b/gitbook-x-prod.appspot.com/o/spaces%2F-MGIlBSTjQtZxUoFwUx4%2Fuploads%2F3j1hjVscRXfFKmF82QWw%2Fimage.png?alt=media\&token=5e48c630-6b66-4eb0-bb2e-3ef17eb5e3f6)

## :gift: New **Features**

#### **1-** Deployment Analytics - **Team Goals**

You can set your organizations' default goals for each stage of the "Lead Time For Changes" breakdown.

![Deployment Analytics default goals - Admin Panel](https://3582076375-files.gitbook.io/~/files/v0/b/gitbook-x-prod.appspot.com/o/spaces%2F-MGIlBSTjQtZxUoFwUx4%2Fuploads%2F12zEetDDEOlXqr8CRRl6%2Fimage.png?alt=media\&token=f2e1c814-33b7-4760-abcc-8fef2cddbc08)

Oobeya checks these goals and displays warnings on the deployment flow to show you where you may improve.

![Lead Time For Changes breakdown - where you may improve.](https://3582076375-files.gitbook.io/~/files/v0/b/gitbook-x-prod.appspot.com/o/spaces%2F-MGIlBSTjQtZxUoFwUx4%2Fuploads%2FvfELNAhmhZ5B1yvrLwtX%2Fimage.png?alt=media\&token=2f2cfe9b-543d-425b-b590-9cc8f0741df6)

#### **2-** Deployment Analytics - **Automated Reanalyze**

We've added new functionality for Deployment Analtyics (BETA): Automated Reanalyze is now ready to use!

#### **3-** Deployment Analytics - **Time Period Comparison**

To track the changes in [DORA metrics](https://oobeya.io/dora-metrics/), we've added a time period comparison: *"Last week" vs. "Previous week".*

!["Last 6 months" vs. "Previous 6 months" ](https://3582076375-files.gitbook.io/~/files/v0/b/gitbook-x-prod.appspot.com/o/spaces%2F-MGIlBSTjQtZxUoFwUx4%2Fuploads%2FOjSwXExfY78pn0xXtBVZ%2Fimage.png?alt=media\&token=61bd84fb-94cd-48a8-8991-aacced83d61b)

#### **4-** Deployment Analytics - **Deploy Size**

We've started to show the size of each deployment pipeline: *Small, Medium, Large, Gigantic.*

![Deploy Size](https://3582076375-files.gitbook.io/~/files/v0/b/gitbook-x-prod.appspot.com/o/spaces%2F-MGIlBSTjQtZxUoFwUx4%2Fuploads%2FtpW8kbBts1YHQokXtlpC%2Fimage.png?alt=media\&token=cba553f6-eae4-4d40-9a39-0d5a380dda66)

#### **5-** DORA Metrics on Team Scorecards

Oobeya [Team Scorecards](/team-health/team-scorecards) now display [DORA Metrics](https://oobeya.io/dora-metrics/), allowing you to track and improve metrics (Lead Time For Changes, Deployment Frequency) at the team level.

#### 6- Gitwiser - Active Analytics Types

On Gitwiser's home page, we've started to show active analytics types for repositories. You can now navigate to the analysis results with ease.

![Gitwiser Active Analytics Types](https://3582076375-files.gitbook.io/~/files/v0/b/gitbook-x-prod.appspot.com/o/spaces%2F-MGIlBSTjQtZxUoFwUx4%2Fuploads%2Fi6PAhWP7uQL9jLw6lPmJ%2Fimage.png?alt=media\&token=e69562a8-d8a0-4a12-912c-b8148a07379f)

#### 7- AgileSpace - Reset Analysis Button

You can now reset your existing [AgileSpace Board Analytics](/project-analytics/project-analytics-metric-definitions) reports via the "Reset Analysis" button. After clicking the button, all history will be removed, but your settings and configuration will be preserved.

![Oobeya AgileSpace Reset Board Analysis](https://3582076375-files.gitbook.io/~/files/v0/b/gitbook-x-prod.appspot.com/o/spaces%2F-MGIlBSTjQtZxUoFwUx4%2Fuploads%2F6Pllpn5XCJUgtTBNqZKW%2Fimage.png?alt=media\&token=c3304104-123f-4ca8-8065-42de45e8715e)

#### 8- Administration - Download System Logs

Now you can download system logs from the administration panel.

![System Logs](https://3582076375-files.gitbook.io/~/files/v0/b/gitbook-x-prod.appspot.com/o/spaces%2F-MGIlBSTjQtZxUoFwUx4%2Fuploads%2FbKeqm8u96WbvLREMKhSx%2Fimage.png?alt=media\&token=1586e55a-53ba-4b54-8336-3db9338be367)


# Oobeya Feb 2022 Updates

Check out the newest features and improvements we've released for you.

:tada: We are excited to introduce our new features and improvements.

### \[BETA] Deployment Analytics (DORA Metrics)&#x20;

We have started developing the "Deployment Analytics" feature to evaluate [DORA metrics](https://cloud.google.com/blog/products/devops-sre/using-the-four-keys-to-measure-your-devops-performance) (Four key metrics).

For the BETA release, you can now calculate two of the DORA metrics for your deployments:

1. **Deployment Frequency**—How often an organization successfully releases to production
2. **Lead Time for Changes**—The amount of time it takes a commit to get into production

![Deployment Analytics (DORA metrics)](https://3582076375-files.gitbook.io/~/files/v0/b/gitbook-x-prod.appspot.com/o/spaces%2F-MGIlBSTjQtZxUoFwUx4%2Fuploads%2F8KQntX3kNrAquvccCDDQ%2Fdeployment-analytics-result.png?alt=media\&token=05dfb6fa-f911-43e2-b2ba-28edc165ccd5)

![Deployments during the selected period (with details and breakdown)](https://3582076375-files.gitbook.io/~/files/v0/b/gitbook-x-prod.appspot.com/o/spaces%2F-MGIlBSTjQtZxUoFwUx4%2Fuploads%2Ft3nGtZAs86vxpGgWLgIq%2Fimage.png?alt=media\&token=f8a1fa70-e354-4390-a7c5-0a1f2889454f)

What we deliver in the BETA release:

* Lead Time For Changes (Breakdown)
* Lead Time For Changes (Average)
* Deployment Frequency (Deployments/day)
* Deployment Frequency (Historical chart)
* Deployments during the selected period (with details and breakdown)

{% hint style="info" %}
***Deployment Analytics*** works with [GitLab CI](/integrations/all-integrations/scm-addons/gitlab-addon) and [AzureDevOps ](/integrations/all-integrations/scm-addons/azure-devops-integration)for now. (Coming soon: *Jenkins, GitHub Actions, Spinnaker, BB Pipelines, Octopus,* and more...)&#x20;
{% endhint %}

With the developments we have done so far, you are able to define your own cross-platform delivery cycle configuration. Then, we will take forward the other DORA metrics (Change Failure Rate and Time to Restore Service) by expanding this configuration with different tools such as incident management (PagerDuty, OpsGenie), change management (ServiceNow, Jira), and APM (NewRelic, Sentry, Dynatrace, etc.) tools.

![Initialize a new Gitwiser Analysis](https://3582076375-files.gitbook.io/~/files/v0/b/gitbook-x-prod.appspot.com/o/spaces%2F-MGIlBSTjQtZxUoFwUx4%2Fuploads%2Fu1EXRM9Am9tqPGor2qbB%2Fdeployment-analytics-start.png?alt=media\&token=310f88a6-4766-45e2-b009-f560fa930ac4)

### Gitwiser

#### Excluded Commits Table

In [Gitwiser ](/gitwiser-repo-analytics/git-analytics-metric-definitions)you can now see all the excluded commits along with the exclusion reasons in a table. You also are able to include them in the analysis.

![Gitwiser Excluded Commits Table](https://3582076375-files.gitbook.io/~/files/v0/b/gitbook-x-prod.appspot.com/o/spaces%2F-MGIlBSTjQtZxUoFwUx4%2Fuploads%2FtfSMtYkYELU2gFp5omDa%2Fimage.png?alt=media\&token=e0e6d835-9f3e-447a-92ee-d42d9143eacd)

### Dashboards

#### Duplicate Dashboards

Now you can effortlessly duplicate your dashboards by using the "Copy From" option.

![Duplicate your dashboards](https://3582076375-files.gitbook.io/~/files/v0/b/gitbook-x-prod.appspot.com/o/spaces%2F-MGIlBSTjQtZxUoFwUx4%2Fuploads%2F6RwzRUzJUW8lwJUmvrmD%2Fimage.png?alt=media\&token=fd0145a5-bbb7-4ca8-a159-0c0af633ab98)

#### Sonarqube Unit Tests Widget

We have added a new pre-defined [widget](/dashboards/adding-a-new-widget) for [Sonarqube ](/integrations/all-integrations/code-quality-addons/sonarqube-integration)addon to show the unit test results of your projects in [Oobeya Dashboards](/dashboards/creating-a-new-dashboard).

![Sonarqube Unit Tests Widget](https://3582076375-files.gitbook.io/~/files/v0/b/gitbook-x-prod.appspot.com/o/spaces%2F-MGIlBSTjQtZxUoFwUx4%2Fuploads%2FGnk3R74tPdznPpkftdlc%2Fimage.png?alt=media\&token=9c134015-4e80-41b1-9cf9-440ff3332b7f)


# Oobeya Jan 2022 Updates

Check out the newest features and improvements we've released for you.

:tada: We are excited to introduce our new features and improvements.

### Personalized Homepage

We have added a new **personalized homepage** to enhance the user experience and help you navigate easily to your Scorecards, repository and agile board analytics in Oobeya. You can also see a list of your **awaiting actions** on your homepage and take action to resolve them.

Personalized Homepage includes:

* Basic profile info (Company role, related accounts and teams of the user)
* Individual and Team Scorecards of the user
* List of favorite dashboards of the user
* List of repositories (Gitwiser analysis) of the user
* List of agile boards (AgileSpace analysis) of the user
* **Awaiting Actions** of the user (tasks in progress, awaiting Pull Request reviews and submits)
* **Recent Activities** timeline (commits, pull requests, project management activities...)

![Oobeya - My Page](https://3582076375-files.gitbook.io/~/files/v0/b/gitbook-x-prod.appspot.com/o/spaces%2F-MGIlBSTjQtZxUoFwUx4%2Fuploads%2FY4BkF8qqhLWhu3T3xAkJ%2Fmy-page-1.png?alt=media\&token=f07aa712-7b56-4876-a94b-214578c82ff1)

### Scorecards

#### UI/UX improvements on Scorecards

We have made UI/UX improvements on Individual and Team Scorecards. New improvements include:

* Added a historical timeline on code quality summary cards.
* Redesigned the summary cards to show the delta and overall values in detail.
* Redesigned the code quality tabs to show the delta and overall values in detail.

![UI/UX improvements on Scorecards](https://3582076375-files.gitbook.io/~/files/v0/b/gitbook-x-prod.appspot.com/o/spaces%2F-MGIlBSTjQtZxUoFwUx4%2Fuploads%2FDTyBohGORUUYLO4m0RrM%2Fscorecard-improvements.png?alt=media\&token=63b9f39b-ffd7-4ebe-8ec9-8fee5293dd11)

#### Pull Requests - Work In Progress

Now you can see the **open pull requests of teams** with PR risk labels (overdue, stale, oversized) in your Scorecards so you can efficiently pinpoint the bottlenecks of your code review cycle. Starting in February, we will be providing more metrics about pull requests.&#x20;

**Note:** In order to see the data on the scorecards, you should perform pull request analysis for your repositories via Gitwiser.

![Work in progress Pull Requests wit risk labels](https://3582076375-files.gitbook.io/~/files/v0/b/gitbook-x-prod.appspot.com/o/spaces%2F-MGIlBSTjQtZxUoFwUx4%2Fuploads%2FZBwA8ais4QQF5peq423I%2FWIP-PR-widget.png?alt=media\&token=0685c201-6bfa-4cbe-82a8-585dda4be8a1)

### Gitwiser

#### Exclude Commits

In Gitwiser you can now exclude commits from analysis results to remove misleading data.

![Exclude commits from analysis](https://3582076375-files.gitbook.io/~/files/v0/b/gitbook-x-prod.appspot.com/o/spaces%2F-MGIlBSTjQtZxUoFwUx4%2Fuploads%2Fg8J5207RgiBI5jN15M1x%2Fgw-exclude.png?alt=media\&token=0e8d5df2-02c5-42ea-9286-357dea28f45f)

You should enter a reason for the exclusion. Starting in February, you will be able to see the excluded commits along with the exclusion reasons and easily include them in the analysis.

![Exclude commits from analysis](https://3582076375-files.gitbook.io/~/files/v0/b/gitbook-x-prod.appspot.com/o/spaces%2F-MGIlBSTjQtZxUoFwUx4%2Fuploads%2FnQq6oyCF56Vc3diM0002%2Fgw-exclude-modal.png?alt=media\&token=35f39028-82fa-4faa-9c1c-dadac473f042)

#### The largest commits in the codebase (by impact score)

In Gitwiser repository analysis now you can see a list of the largest commits of your codebase. With this list, you can effortlessly explore the largest development activities and detect outliers to exclude from the analysis.

![List of the largest commits](https://3582076375-files.gitbook.io/~/files/v0/b/gitbook-x-prod.appspot.com/o/spaces%2F-MGIlBSTjQtZxUoFwUx4%2Fuploads%2Fr7sudvxQ3PIrKG0zDhHD%2Fgw-largest.png?alt=media\&token=ada2b938-f68b-4664-9ebc-085d8c62fbb7)

### Leagues

We have started making improvements to Leagues in Oobeya's gamification module. You can see a scoring timeline for each team on the League Leaderboard page.

![League Scoreboard with timeline](https://3582076375-files.gitbook.io/~/files/v0/b/gitbook-x-prod.appspot.com/o/spaces%2F-MGIlBSTjQtZxUoFwUx4%2Fuploads%2F9xCTlTY1eLfCgP5deWa0%2Fleague-timeline.png?alt=media\&token=c75159dd-f69b-4362-b624-1eecb146728e)


# OOBEYA-2.0.8 - Release Notes

## OOBEYA-2.0.8 :rocket: - *New Jira Widgets, Sentry Self-hosted Support, Improvements, UI/UX Enhancements, and more...*

:tada: We are excited to introduce our new features and improvements. We have added new widgets for Jira Server & Cloud and implemented a new infrastructure for setting metric thresholds on dashboard widgets.

## :new: NEW FEATURES

### Jira Sprint Report - Work Distribution Widget :bar\_chart:  <a href="#metrics-with-jql-widget-new-metric-resolution-time-avg" id="metrics-with-jql-widget-new-metric-resolution-time-avg"></a>

We've added a new Jira widget to visualize work distribution for reporting Sprints. You can track and analyze your teams' work with this widget.

![Jira Sprint Work Distribution Widget](https://3582076375-files.gitbook.io/~/files/v0/b/gitbook-legacy-files/o/assets%2F-MGIlBSTjQtZxUoFwUx4%2F-Mk6BxYqa7ijHwJsvOqe%2F-Mk6DRNmjTd1mWbF32lj%2Fimage.png?alt=media\&token=79441b7b-5336-4974-a509-87f71cafa2d2)

### Jira Issue Distribution Chart Widget :doughnut:  <a href="#metrics-with-jql-widget-new-metric-resolution-time-avg" id="metrics-with-jql-widget-new-metric-resolution-time-avg"></a>

We've added a new widget for Jira to show issue distribution. Generate the distribution chart of Jira issues by using custom JQLs.&#x20;

![Jira Issue Distribution Widget](https://3582076375-files.gitbook.io/~/files/v0/b/gitbook-legacy-files/o/assets%2F-MGIlBSTjQtZxUoFwUx4%2F-Mk62cc8ebxM2Bp7_WKJ%2F-Mk64SkXXR-MTSpl93Hl%2Fimage.png?alt=media\&token=783abd9b-33c2-4d5c-88eb-011fdc82d329)

This helps you see the breakdown of a set of issues, at a glance.

![See the breakdown of a set of issues, at a glance.](https://3582076375-files.gitbook.io/~/files/v0/b/gitbook-legacy-files/o/assets%2F-MGIlBSTjQtZxUoFwUx4%2F-Mk62cc8ebxM2Bp7_WKJ%2F-Mk64nyuJvFud1pd0Sc2%2Fimage.png?alt=media\&token=56fdcfba-ff7b-437e-a7e0-e2c591739dbc)

### Azure DevOps Deployment Frequency Widget :bar\_chart:&#x20;

![Azure DevOps Deployment Frequency Widget](https://3582076375-files.gitbook.io/~/files/v0/b/gitbook-legacy-files/o/assets%2F-MGIlBSTjQtZxUoFwUx4%2F-Mk6LI9YUpnHbOBXhB0S%2F-Mk6MKxYs5RrCK12IMY5%2Fimage.png?alt=media\&token=8215da14-ed74-4dbb-812d-b740afd482c1)

### Azure DevOps Lead Time Widget :chart\_with\_upwards\_trend:&#x20;

![Adding Lead Time Widget](https://3582076375-files.gitbook.io/~/files/v0/b/gitbook-legacy-files/o/assets%2F-MGIlBSTjQtZxUoFwUx4%2F-Mk6LI9YUpnHbOBXhB0S%2F-Mk6LplJRwQRReJ0k2wP%2Fimage.png?alt=media\&token=6e2f77a4-37e6-47ce-bd57-ea9b21e17621)

![Azure DevOps Lead Time Widget](https://3582076375-files.gitbook.io/~/files/v0/b/gitbook-legacy-files/o/assets%2F-MGIlBSTjQtZxUoFwUx4%2F-Mk6LI9YUpnHbOBXhB0S%2F-Mk6LevfRKxpvsiHqUIj%2Fimage.png?alt=media\&token=059e02f3-cd00-4265-8ccc-c376c6cfaa28)

## :muscle: IMPROVEMENTS

### Sentry Self-hosted Integration :jigsaw:&#x20;

We have already integrated with Sentry Cloud, now we've started to support Sentry's self-hosted edition.

### Improvements On Work Type Table :muscle:&#x20;

We've added new metrics to the work type table on Team Scorecard.

![Team Scorecard Work Type Table](https://3582076375-files.gitbook.io/~/files/v0/b/gitbook-legacy-files/o/assets%2F-MGIlBSTjQtZxUoFwUx4%2F-Mk6MaDW4NproIyH6i6Z%2F-Mk6N5FLWNfN019xbCFW%2Fimage.png?alt=media\&token=0153aac8-275e-45ef-a841-dc12dc7c43ff)

### Navigation to Integration Document :page\_facing\_up:&#x20;

We have added a link to the data source modal to reach the integration document easily.

![](https://3582076375-files.gitbook.io/~/files/v0/b/gitbook-legacy-files/o/assets%2F-MGIlBSTjQtZxUoFwUx4%2F-Mk6FXsSOWSs3GrFFG5z%2F-Mk6HDTt9z-BpxU8O-d7%2Fimage.png?alt=media\&token=4e6c8ddb-ee84-49e0-8272-bb8cbcddc940)

### Unlock User From Admin Panel :unlock:&#x20;

Now you are able to unlock the locked user accounts from the administration panel.

![Unlock users from admin ](https://3582076375-files.gitbook.io/~/files/v0/b/gitbook-legacy-files/o/assets%2F-MGIlBSTjQtZxUoFwUx4%2F-Mk62cc8ebxM2Bp7_WKJ%2F-Mk66a_RfBo39ByJR-ew%2Fimage.png?alt=media\&token=33179728-2d31-4c90-9b94-2e98632083cf)


# OOBEYA-2.0.4 - Release Notes

## OOBEYA-2.0.4 :rocket: - *New Jira Widgets, Metric Thresholds, Improvements, UI/UX Enhancements, and more...*

:tada: We are excited to introduce our new features and improvements. We have added new widgets for Jira Server & Cloud and implemented a new infrastructure for setting metric thresholds on dashboard widgets.

## :new: NEW FEATURES

### Metrics With JQL Widget **- New Metric: Resolution Time (avg)** :clock5:&#x20;

We've added a new *metric type* for "Metrics With JQL Widget": ***Resolution Time (avg)***. This metric shows the average resolution time of the issues for the given JQL.

{% hint style="info" %}
The "Resolution Time" is the difference between an issue's Resolution Date and Created date. See the Jira docs [here](https://confluence.atlassian.com/jirakb/how-resolution-time-is-calculated-278072482.html).
{% endhint %}

![Average Resolution Time in 2021](https://3582076375-files.gitbook.io/~/files/v0/b/gitbook-legacy-files/o/assets%2F-MGIlBSTjQtZxUoFwUx4%2F-Mch_tQlP1Y1ccDE5XQe%2F-Mche_31iO1szcCY4Wlt%2Fimage.png?alt=media\&token=412d78d1-548f-4654-9797-562c7dbbd5c1)

![project = DAS AND Resolution = Done AND resolved >= startOfYear()](https://3582076375-files.gitbook.io/~/files/v0/b/gitbook-legacy-files/o/assets%2F-MGIlBSTjQtZxUoFwUx4%2F-Mch_tQlP1Y1ccDE5XQe%2F-Mchf5OW41mtmz_XGrml%2Fimage.png?alt=media\&token=bb87f4a3-9072-45db-b644-a1df3f24e5e5)

### **Jira Issue Search Widget - New Column: Resolution Time** :clock5:&#x20;

We've added a new *column* for "Jira Issue Search Widget": ***Resolution Time***. This column shows the resolution time of each issue in the table.

![Resolution Time column for Jira Issues Table Widget.](https://3582076375-files.gitbook.io/~/files/v0/b/gitbook-legacy-files/o/assets%2F-MGIlBSTjQtZxUoFwUx4%2F-MchhXzs1kckYfFDaSQE%2F-Mchii9jo9Ru_MNRL4t0%2Fimage.png?alt=media\&token=a0de5e52-6a7e-4aef-9d03-11da1439e0fe)

![Resolved Issues in 2021 with resolution time.](https://3582076375-files.gitbook.io/~/files/v0/b/gitbook-legacy-files/o/assets%2F-MGIlBSTjQtZxUoFwUx4%2F-MchhXzs1kckYfFDaSQE%2F-MchjXX8awXkLwTXhmDx%2Fimage.png?alt=media\&token=6b73a981-e74d-4371-bfff-7076df00a87a)

### **New Widget: Jira Issue Aging Chart** :chart\_with\_upwards\_trend:&#x20;

We've launched a new *widget* for Jira [Cloud ](/integrations/all-integrations/project-management-addons/jira-cloud-integration)& [Server ](/integrations/all-integrations/project-management-addons/jira-server-integration)Addon: ***Jira Issue Aging Chart***. This widget visualizes the age of open issues for the given JQL.

![Visualizes the age of unresolved issues.](https://3582076375-files.gitbook.io/~/files/v0/b/gitbook-legacy-files/o/assets%2F-MGIlBSTjQtZxUoFwUx4%2F-Mchl3l2TvlRrB86xHg6%2F-MchlM17thvFWJoRb-Yv%2Fimage.png?alt=media\&token=e299c46d-d65f-4011-b917-34d5e6fc5bef)

![Issue Aging Chart](https://3582076375-files.gitbook.io/~/files/v0/b/gitbook-legacy-files/o/assets%2F-MGIlBSTjQtZxUoFwUx4%2F-Mchl3l2TvlRrB86xHg6%2F-MchmdS_Seb9DjQ58xMM%2Fimage.png?alt=media\&token=0279dbf3-f3ff-4e93-ae60-05dc2eedcde4)

### **Metric Threshold For JQL Widget** :vertical\_traffic\_light:&#x20;

We've built an infrastructure for Metric Thresholds and released the first widget implementation.

You can now set thresholds for the metrics in the "Metrics With JQL" Widget.

![Setting metric thresholds.](https://3582076375-files.gitbook.io/~/files/v0/b/gitbook-legacy-files/o/assets%2F-MGIlBSTjQtZxUoFwUx4%2F-MchnrqdXcZ8Xaqx9C1Z%2F-Mchpyj39yE2nbvXzw8g%2Fimage.png?alt=media\&token=6828ac97-bbf2-41a8-b59c-078bf169089c)

![Metrics With JQL Widget](https://3582076375-files.gitbook.io/~/files/v0/b/gitbook-legacy-files/o/assets%2F-MGIlBSTjQtZxUoFwUx4%2F-Mchq1VquiC9Re-Rekoe%2F-MchrgToPUj6XmiMZ1JK%2Fimage.png?alt=media\&token=329bcb60-6364-40e0-9d22-4967006bf863)

### **Gitwiser PR Analysis: GitHub Pull Request Review Stats**

We've added a new widget "Review Stats" for Gitwiser's Pull Request Analytics (PRA) module. Now, this feature is only available for GitHub Addon.

![Shows the Pull Request review stats to pinpoint bottlenecks of the code review process.](https://3582076375-files.gitbook.io/~/files/v0/b/gitbook-legacy-files/o/assets%2F-MGIlBSTjQtZxUoFwUx4%2F-McrcR1-1EpsGTs1qJr0%2F-McrcV6FX4tj6bEJEIpB%2Fimage.png?alt=media\&token=6615b472-cbba-4b83-aa61-c0120c0666d1)

## :muscle: IMPROVEMENTS

### Show Company Roles In The User Table:new:&#x20;

We've added a new *column* to the user table:

![Administration > Users & Groups](https://3582076375-files.gitbook.io/~/files/v0/b/gitbook-legacy-files/o/assets%2F-MGIlBSTjQtZxUoFwUx4%2F-MchseH3ce8W4UzBuwnq%2F-Mci0Gk_qVXTrNmvU6Zd%2Fimage.png?alt=media\&token=f558c3cb-3146-467c-82af-d7946b00a5c9)

### New Company Role: Tech Lead:new:&#x20;

We've added a new *company role* to the role list: Tech Lead. You can add it to your company role list.

![](https://3582076375-files.gitbook.io/~/files/v0/b/gitbook-legacy-files/o/assets%2F-MGIlBSTjQtZxUoFwUx4%2F-Mci0MPXLfht-Tm2q-pD%2F-Mci1PatBhVykZ3m96V5%2Fimage.png?alt=media\&token=f236fdef-097a-4154-bcf6-48c377b1a11a)

### Suggest Repositories While Initializing Team Scorecard :man\_technologist::woman\_technologist:&#x20;

We've started to suggest Git repositories related to team members while initializing Team Scorecard.

![Team Scorecard Initialize](https://3582076375-files.gitbook.io/~/files/v0/b/gitbook-legacy-files/o/assets%2F-MGIlBSTjQtZxUoFwUx4%2F-Mci1b4kiH5Fnwoyln8e%2F-Mci262YTpVq8wlDI8rR%2Fimage.png?alt=media\&token=16df0647-1070-4455-a71a-2587af8e2401)

### Select Automatically If There Is Only One Branch&#x20;

We've started to select the branch automatically if there is only one branch available.&#x20;

![Team Scorecard Initialize](https://3582076375-files.gitbook.io/~/files/v0/b/gitbook-legacy-files/o/assets%2F-MGIlBSTjQtZxUoFwUx4%2F-Mci3PnIqBpsw-GlcuS5%2F-Mci3ildfEQmdH7ofMPH%2Fimage.png?alt=media\&token=272245bb-e9b8-498d-aa7d-2b1dda87e4a3)

### Gitwiser - Commits Per File List

We've increased the number of files listed in the "Commits Per File" widget:

![Commits Per File - Top 50](https://3582076375-files.gitbook.io/~/files/v0/b/gitbook-legacy-files/o/assets%2F-MGIlBSTjQtZxUoFwUx4%2F-Mci5KLpWnPuYhvH9XEf%2F-Mci8XvgphEbSCMjvvFl%2Fimage.png?alt=media\&token=5e4768de-9189-40a8-b1ef-e660db7c1748)

## :lady\_beetle: FIXES

* Fixed - Navigate to the analysis pending page after updating the Gitwiser Analysis exclusion list.
* Fixed - Upper-Level team list problem while adding a new team.


# OOBEYA-2.0.0

Oobeya 2.0 released with Git Analytics feature.

## OOBEYA-2.0.0 :rocket: - *Git Analytics: Commit Work Type, Commit Impact, Scorecards Enhancements, and more...*

:tada: We are excited to introduce major features under ***"Git Analytics"*** that strive to make your teams more productive. We have improved *Gitwiser* (our analyzer for Git repositories) to ***analyze coding activities deeper*** and to ***pinpoint bottlenecks*** in the software development process.

**Oobeya 2.0** now provides you more metrics and insights to open the black-boxes of your engineering processes.

![](https://3582076375-files.gitbook.io/~/files/v0/b/gitbook-legacy-files/o/assets%2F-MGIlBSTjQtZxUoFwUx4%2F-MamNbOr3Bv1JvyrANtV%2F-MamTRRhDw4VWpnFhKh1%2FOobeya%202.0.0%20released%20\(1\).png?alt=media\&token=59a7cf09-551d-4fab-acc4-30c9fd8dfbd2)

## :new: NEW FEATURES

### **Gitwiser Git Analytics** - ***A deeper understanding of development activities*****.**

We've added new features to **Gitwiser** -*Oobeya's git repository analyzer*. Gitwiser started to analyze all the commits data of repositories. Therefore, we are ready now to provide you more metrics and insights in Oobeya. We have enhanced both **Individual** and **Team Scorecards** with Git Analytics metrics.

{% hint style="info" %}
After upgrading Oobeya, Git commits analysis will be performed in the first reanalyze process for your existing analyses.
{% endhint %}

### **Commit Work Type Analysis** :traffic\_light:&#x20;

Gitwiser analyzes all commits in the code repositories and identifies the work type of each coding activity. *Work type analysis* provides you more insight into the health of your development lifecycle.&#x20;

See below the Git commit work types:

* :new:**New Work:** Newly written code lines.
* :tools:**Refactor:** Edits and updates made on the existing code (*written more than 3 weeks old*).
* :woman\_technologist:**Help Others (Pairings):** Edits and updates made on another developer's recent work (*written less than 3 weeks old*).
* :repeat:**Churn (Rework):** Code that rewritten or deleted in a short time by the same developer after being written (*less than 3 weeks*).

![Git commit work types & company average line](https://3582076375-files.gitbook.io/~/files/v0/b/gitbook-legacy-files/o/assets%2F-MGIlBSTjQtZxUoFwUx4%2F-MaU3vVmYOood6q73fK2%2F-MaU5rv-6iw5yDTIv2FW%2Fimage.png?alt=media\&token=f26e19e2-4e85-4f8d-8807-37498d980f43)

### **Git Analytics Metrics: Impact & Efficiency** :dart:&#x20;

Git Analytics offers you also two new metrics to pinpoint bottlenecks, risks, and workloads of your development lifecycle.

* **Impact Score:** A way of measuring the extent of code changes that occur. Impact Score allows us to find answers to these questions:

  * Approximately how much cognitive load did the engineer perform when implementing these changes?
  * What is the overall impact of these changes on the codebase?

* **Efficiency:** The percentage of productive work (which is not rework or code churn).

We believe organizations and teams need more than a single dimension or metric to get a deeper understanding of how they are working. Therefore, we calculate and provide commit impact and efficiency metrics at different levels:

* [x] Commit-Level&#x20;
* [ ] Repository-Level (*upcoming*)
* [x] Individual-Level
* [x] Team-Level
* [ ] Organization-Level (*upcoming*)

### **Scorecards - New Design And Enhancements** :sparkles:&#x20;

We've received your feedback and made some major UI/UX enhancements on Individual and Team Scorecards. Now Scorecards have a more explicit view than before and it is easier to see trends on metrics.

![Individual Scorecard with new metrics and design](https://3582076375-files.gitbook.io/~/files/v0/b/gitbook-legacy-files/o/assets%2F-MGIlBSTjQtZxUoFwUx4%2F-MaU3vVmYOood6q73fK2%2F-MaU6ANh94c0ZOJXypM3%2Fimage.png?alt=media\&token=d51d0982-b295-4fa2-b764-93ad7a8cfea3)

![Team Scorecard with new metrics and design](https://3582076375-files.gitbook.io/~/files/v0/b/gitbook-legacy-files/o/assets%2F-MGIlBSTjQtZxUoFwUx4%2F-MaU3vVmYOood6q73fK2%2F-MaU73ZFQ3Z1bBbD_jG6%2Fimage.png?alt=media\&token=46b56c8f-2bec-468f-9ed8-003b29a00279)

### **Gitwiser Analysis Exclusions** :scissors:&#x20;

We've added a new exclusion field for Gitwiser analysis. We give you several options for configuring exactly what will be analyzed in Gitwiser. You can completely exclude some files or directories from Gitwiser analysis.

| Example              | Scope                                                              |
| -------------------- | ------------------------------------------------------------------ |
| \*\*/\*.xml          | Excludes all *xml* files from Gitwiser analysis.                   |
| \*\*/data.json       | Excludes all *data.json* files from Gitwiser analysis.             |
| \*\*/\*sample\*/\*\* | Excludes directories that include "*sample*" in their folder name. |

![You can set your exclusion patterns while starting a new analysis.](https://3582076375-files.gitbook.io/~/files/v0/b/gitbook-legacy-files/o/assets%2F-MGIlBSTjQtZxUoFwUx4%2F-MaYZqSBmHgVNGY-4-Ph%2F-MaYb9Z2l12cZhb4KdIA%2Fimage.png?alt=media\&token=420e3398-beeb-4d24-8b2c-57d70d05cd68)

![You can also update exclusion list later.](https://3582076375-files.gitbook.io/~/files/v0/b/gitbook-legacy-files/o/assets%2F-MGIlBSTjQtZxUoFwUx4%2F-MaYZqSBmHgVNGY-4-Ph%2F-MaYbpiyntDv-9J7aKOc%2Fimage.png?alt=media\&token=f275fe15-8dbc-43ef-ba86-0d8224a04282)

### **Gitwiser Analysis & Team Relation** :gear:&#x20;

We've added a new field for selecting Team relation for Gitwiser analysis. This repo & branch selection will be added to your Team Scorecard configuration.

![You can set team relation while starting a new analysis.](https://3582076375-files.gitbook.io/~/files/v0/b/gitbook-legacy-files/o/assets%2F-MGIlBSTjQtZxUoFwUx4%2F-MaYfH7kyBAPM4_xmJml%2F-MaYhE2xrXEsk-bXxUPr%2Fimage.png?alt=media\&token=a2e908a0-3aff-4ae1-a214-f805cca55acc)

![You can also update Team relation later.](https://3582076375-files.gitbook.io/~/files/v0/b/gitbook-legacy-files/o/assets%2F-MGIlBSTjQtZxUoFwUx4%2F-MaYfH7kyBAPM4_xmJml%2F-MaYh032bb-PvS3l5982%2Fimage.png?alt=media\&token=32050a5f-9312-4b75-bc78-8402bae37892)

### **Show Team Info On Gitwiser Main List** :information\_source:&#x20;

We've just started to show related Team info on the Gitwiser main list.

![Team info on Gitwiser main list](https://3582076375-files.gitbook.io/~/files/v0/b/gitbook-legacy-files/o/assets%2F-MGIlBSTjQtZxUoFwUx4%2F-MaYfH7kyBAPM4_xmJml%2F-MaYj1U3Z8x42kl44mbR%2Fimage.png?alt=media\&token=ccc9056e-4dc1-41d0-9648-3b5dcda93cca)

### **Merge Git Accounts Easily** :star\_struck: **With Developer Profiles**&#x20;

You can now easily merge related git accounts (emails, usernames...) with Profiles defined on Oobeya.&#x20;

![Merge related accounts with Oobeya users.](https://3582076375-files.gitbook.io/~/files/v0/b/gitbook-legacy-files/o/assets%2F-MGIlBSTjQtZxUoFwUx4%2F-MaYfH7kyBAPM4_xmJml%2F-MaYkJhZZE6-6zJ0XEma%2Fimage.png?alt=media\&token=2e46328a-90a2-4388-bf56-64a3a0190a93)

Before this feature, you should go to the Profile detail and open the "Update Profile" popup to add a new related git account.

![The old & hard way of adding related account to a profile.](https://3582076375-files.gitbook.io/~/files/v0/b/gitbook-legacy-files/o/assets%2F-MGIlBSTjQtZxUoFwUx4%2F-MaYloaEHPGShctFl4Ms%2F-MaYmDM8RT1Osk-rneIo%2Fimage.png?alt=media\&token=e540c9c3-dd53-4197-b41e-b70c319416ba)


# OOBEYA-1.4.6

Elastic APM / TestRail / Sentry Addons, Git Analytics for GitLab Cloud & Bitbucket Server, and more...

## OOBEYA-1.4.6 - *Elastic APM / TestRail / Sentry Addons, Git Analytics for GitLab Cloud & Bitbucket Server...*

We have implemented changes to improve your experience with Oobeya. *See all the changes live in Oobeya Playground...*  :point\_right: [*Go to Playground*](https://playground.oobeya.io/)

![](https://3582076375-files.gitbook.io/~/files/v0/b/gitbook-legacy-files/o/assets%2F-MGIlBSTjQtZxUoFwUx4%2F-M_stOvhfGrzDTbqVMs7%2F-M_stZ9yl_mYYIjTEisp%2FOobeya-1.4.6.png?alt=media\&token=4253812b-e754-4a71-9e16-e4c09d59bec3)

### :new: NEW FEATURES

**TestRail Addon (Test & QA)** :jigsaw: \
We've just released the TestRail Addon on Oobeya Market Place. You can monitor test execution reports on Oobeya Dashboards now. Learn how to integrate Oobeya with your TestRail account [here](/integrations/all-integrations/code-quality-addons/testrail-integration)[.](https://docs.oobeya.io/integrations/apm-monitoring-addons/sentry-integration)

**Sentry Addon (APM)** :jigsaw: \
We've released the Sentry Addon on Oobeya Market Place. You can track Sentry issues on Oobeya Dashboards now. Learn how to integrate Oobeya with your Sentry account [here](/integrations/all-integrations/apm-monitoring-addons/sentry-integration)[.](https://docs.oobeya.io/integrations/apm-monitoring-addons/sentry-integration)

**Elastic APM Addon (APM)** :jigsaw: \
We've released the Elastic APM Addon on Oobeya Market Place. You can monitor APM metrics on Oobeya Dashboards now.&#x20;

**Table/List Widget For Custom Addons** :bookmark\_tabs: \
We've added a new widget type for Custom Addon development. Now you can create table widgets with your custom addons. Learn how to develop a custom addon [here](https://github.com/dashboardqa/custom-addon-template).

**New Relic Transactions Widget** :bar\_chart: \
We've added a new predefined widget (Top Web Transactions by # of calls) for New Relic Addon. You can list your web transactions by the number of calls. Learn how to integrate Oobeya with your New Relic account [here](/integrations/all-integrations/apm-monitoring-addons/new-relic-integration)[.](https://docs.oobeya.io/integrations/apm-monitoring-addons/sentry-integration)

**GitLab Cloud Integration** :electric\_plug: \
We already had an integration with [GitLab Enterprise](/integrations/all-integrations/scm-addons/gitlab-addon). We now also support integration with GitLab Cloud. You can add your gitlab.com account as a GitLab [data source](/integrations/adding-new-integration/adding-a-new-data-source) on Oobeya to[ analyze your GitLab repos](broken://pages/-MGIrMC8EqiUIlw9lI0P).&#x20;

**Pull Requests Analytics for Bitbucket Server** :electric\_plug: \
We are ready to analyze pull requests on Bitbucket Server after Bitbucket Cloud, GitHub, GitLab, Azure DevOps Server & Cloud. You can [analyze Bitbucket Server repositories](broken://pages/-MGIrMC8EqiUIlw9lI0P) now to improve code review workflow and to reduce cycle time.

**Amazon DocumentDB Support** :handshake: \
Now we officially support Amazon DocumentDB as a database. Learn more about Amazon DocumentDB [here](https://aws.amazon.com/documentdb/).

### :muscle: IMPROVEMENTS

**Design improvements For UX** :cherry\_blossom: \
We've performed responsive design improvements on Jira Issues widget, Individual, and Team Scorecards.

**Account Session Timeout & Account Lockout** :lock: \
We've added session timeout and account lockout features to improve security on Oobeya.

**Duplicate Analysis Check on Gitwiser** \
We started checking repo/branch selection (Git) and path (for SVN, TFVC) to avoid duplicate analysis on Gitwiser.

### :lady\_beetle: FIXES

* [x] Fixed crash on Scorecards and Executive Dashboard when Sonarqube API returns an error message if response count is more than 10k.
* [x] Fixed update problem of data sources when the API Token field (optional) was set as empty.
* [x] Fixed issue on Custom Addon when the API Token field (optional) was set as empty.
* [x] Fixed problem of searching for child items.
* [x] Fixed code quality drawer listing & sorting issues on Executive Dashboard.
* [x] Fixed issue while showing the display name of custom addons.


# QAD-1.0 - 1.4

## QAD-1.4.0 - *Executive Dashboard, Organizational Chart, Pull Request Analytics improvements...*

*See all the changes live in Oobeya Playground...*  :point\_right: [*Go to Playground*](https://playground.oobeya.io/)

### :new: New Features

* **Executive Dashboard:** Executive Dashboard enables senior leadership to monitor and understand the metrics of organizational units. This executive report provides actionable insights into software development quality and efficiency.

![Oobeya Executive Dashboard - Organization-wide metrics](https://3582076375-files.gitbook.io/~/files/v0/b/gitbook-legacy-files/o/assets%2F-MGIlBSTjQtZxUoFwUx4%2F-MX0ulpwEwLccl3vycwj%2F-MX0xR9HmkuqOvI0FaQw%2Fimage.png?alt=media\&token=6ce32396-4c37-4d3f-a3c6-0691be9348c5)

![Executive Report of development units](https://3582076375-files.gitbook.io/~/files/v0/b/gitbook-legacy-files/o/assets%2F-MGIlBSTjQtZxUoFwUx4%2F-MX0ulpwEwLccl3vycwj%2F-MX0wdXM7zGioIJux5FJ%2Fimage.png?alt=media\&token=e7c04197-0ac6-40cf-a315-e626358fb85c)

You can set **goals** for the metrics you report:

![](https://3582076375-files.gitbook.io/~/files/v0/b/gitbook-legacy-files/o/assets%2F-MGIlBSTjQtZxUoFwUx4%2F-MX0ulpwEwLccl3vycwj%2F-MX11SzF-UMmLf112k-y%2Fimage.png?alt=media\&token=0c174e98-97b6-4acc-97fd-1249abf40ef0)

* **Organizational Chart:** You can define your company's organizational chart on Oobeya. Executive Dashboard will be created according to this organizational chart configuration.

![Organizational Chart configuration](https://3582076375-files.gitbook.io/~/files/v0/b/gitbook-legacy-files/o/assets%2F-MGIlBSTjQtZxUoFwUx4%2F-MX0ulpwEwLccl3vycwj%2F-MX0yD_NJiMTazQBB_X_%2Fimage.png?alt=media\&token=6df1d880-5e33-4923-b6e4-a8a7e9eacbd4)

![Teams](https://3582076375-files.gitbook.io/~/files/v0/b/gitbook-legacy-files/o/assets%2F-MGIlBSTjQtZxUoFwUx4%2F-MX0ulpwEwLccl3vycwj%2F-MX10Tzym_WgidVOS1Em%2Fimage.png?alt=media\&token=d52f6a13-8da6-4069-9822-949bc6a153dc)

* **Bitbucket Cloud Pull Request Analytics:** PRA is now ready-to-use for Bitbucket Cloud repositories.

![](https://3582076375-files.gitbook.io/~/files/v0/b/gitbook-legacy-files/o/assets%2F-MGIlBSTjQtZxUoFwUx4%2F-MX0ulpwEwLccl3vycwj%2F-MX1439UmpmuIxMY8upM%2Fimage.png?alt=media\&token=a90927c0-72c5-458d-9187-6b12f4513e74)

* **PRA Default Goal Settings:** You can set default goals for the pull request analytics metrics.

![PRA default goals](https://3582076375-files.gitbook.io/~/files/v0/b/gitbook-legacy-files/o/assets%2F-MGIlBSTjQtZxUoFwUx4%2F-MX0ulpwEwLccl3vycwj%2F-MX14Rsh8-wsEFvaNvok%2Fimage.png?alt=media\&token=8f77fde9-edb7-44b2-9f3c-ae65190dca9e)

### :muscle: Improvements

* **Jira Sprint Progress widget:** Support Kanban Boards for Jira Agile Progress widget.&#x20;

![](https://3582076375-files.gitbook.io/~/files/v0/b/gitbook-legacy-files/o/assets%2F-MGIlBSTjQtZxUoFwUx4%2F-MX0ulpwEwLccl3vycwj%2F-MX12qWt3El_o_jHx4zE%2Fimage.png?alt=media\&token=1cab19a4-5f4a-4540-8609-4a4f86ebf038)

* **Jira Sprint Progress widget:** Removed project field. Added "Current Sprint" option.&#x20;

![](https://3582076375-files.gitbook.io/~/files/v0/b/gitbook-legacy-files/o/assets%2F-MGIlBSTjQtZxUoFwUx4%2F-MX0ulpwEwLccl3vycwj%2F-MX134GPcf2X2UPveJsg%2Fimage.png?alt=media\&token=7b29d21f-ae6d-4a91-91cb-821af0c20a17)

* Updates for the new product name.

![](https://3582076375-files.gitbook.io/~/files/v0/b/gitbook-legacy-files/o/assets%2F-MGIlBSTjQtZxUoFwUx4%2F-MX0ulpwEwLccl3vycwj%2F-MX13Ia6n6HuwijQZY9y%2Foobeya_logo.png?alt=media\&token=5179604d-6ebc-4821-b6b1-ab700fe91dd2)

### :lady\_beetle: Fixes

* Fixed - Jenkins Multibranch pipeline listing problem.&#x20;
* Fixed - GitHub Pull Request Analytics tooltip problem.
* Fixed - Set Gitwiser analysis status as "Failed" if the cloning process was failed.&#x20;

## QAD-1.3.2 - *Custom Addon, GitHub Pull Request Analytics, GitLab Clone with SSH...*

*See all the changes live in QA Dashboard Playground...*  :point\_right: [*Go to Playground*](https://playground.oobeya.io/)

### :new: New Features

* :jigsaw: **Custom Addon:** We have launched *Custom Addon* integration for the QA Dashboard Market Place. Users can develop a connector application and integrate their own tools to QA Dashboard.&#x20;

![Adding custom addon to Market Place](https://3582076375-files.gitbook.io/~/files/v0/b/gitbook-legacy-files/o/assets%2F-MGIlBSTjQtZxUoFwUx4%2F-MVL-pe35uho3sCD2Oqt%2F-MVL3Uy9C3SO4pS73ky0%2Fimage.png?alt=media\&token=3804e34c-ab33-4b9e-898d-9b8db53420ba)

{% hint style="info" %}
Check out the custom addon template with the documentation on GitHub: <https://github.com/dashboardqa/custom-addon-template>

<img src="https://3582076375-files.gitbook.io/~/files/v0/b/gitbook-legacy-files/o/assets%2F-MGIlBSTjQtZxUoFwUx4%2F-MVL-pe35uho3sCD2Oqt%2F-MVL3s0SHXzKNOrN7Xo3%2Fimage.png?alt=media&amp;token=606cbc76-27d7-42a9-a664-cdfb9b273d61" alt="" data-size="original">
{% endhint %}

* **GitHub Pull Request Analytics:** We have added the Pull Request Analytics (PRA) module of Gitwiser for GitHub repositories. You can analyze the pull requests of existing repositories in Gitwiser by clicking the start button on the PRA tab.<br>
* **GitLab - Clone with SSH:** We started to support cloning GitLab repositories with SSH.

![](https://3582076375-files.gitbook.io/~/files/v0/b/gitbook-legacy-files/o/assets%2F-MGIlBSTjQtZxUoFwUx4%2F-MVL-pe35uho3sCD2Oqt%2F-MVL4YQ1ULlHtdgETyca%2Fimage.png?alt=media\&token=8ed3608c-9660-4ce1-a4b9-6f7a06d129da)

## QAD-1.2.0 - *Slack & Microsoft Teams Notifiers for individuals and teams...*

*See all the changes live in QA Dashboard Playground...*  :point\_right: [*Go to Playground*](https://playground.dashboard.qa)

### :new: New Features

* :bell: **Slack Notifier:** We have added a ***Slack*** notifier for **individuals** and **teams**. \
  QA Dashboard has an integration with Slack to send notifications and reports into your own chat channels. See the steps [here ](/alerts-and-notifications/adding-notifications-for-slack)to add notifiers for Slack.

![Individuals can set notifiers to get insights into their activities and metrics.](https://3582076375-files.gitbook.io/~/files/v0/b/gitbook-legacy-files/o/assets%2F-MGIlBSTjQtZxUoFwUx4%2F-MTA7eEsruhjQu4t2fFf%2F-MTACb-J3xWSGrZCnW7-%2Fimage.png?alt=media\&token=b76a5c08-6955-4b29-81f3-2aa7c9678ff5)

*See the sample message for an individual:*

![](https://3582076375-files.gitbook.io/~/files/v0/b/gitbook-legacy-files/o/assets%2F-MGIlBSTjQtZxUoFwUx4%2F-MTA7eEsruhjQu4t2fFf%2F-MTADhhBh92MIRgYyUQq%2Fimage.png?alt=media\&token=690ea98f-7ddf-4818-878e-fa0ddc8d7e2c)

*See the sample message for a team:*

![](https://3582076375-files.gitbook.io/~/files/v0/b/gitbook-legacy-files/o/assets%2F-MGIlBSTjQtZxUoFwUx4%2F-MTAmLimPn0dUbOg5Fh-%2F-MTAmUCOfHGPbn0TR4D5%2Fimage.png?alt=media\&token=b67ac965-f334-417a-b4b9-ad4e23bcadea)

* :bell: **MS Teams Notifier:** We have added ***MS Teams*** notifier for **individuals** and **teams**.\
  [**QA Dashboard**](https://dashboard.qa) has an integration with **Microsoft Teams** to send notification messages and reports into your own channels. See the steps [here ](/alerts-and-notifications/adding-notifications-for-ms-teams)to add *channels, connectors, incoming webhooks* for MS Teams.

![Individuals can set notifiers to get insights into their activities and metrics.](https://3582076375-files.gitbook.io/~/files/v0/b/gitbook-legacy-files/o/assets%2F-MGIlBSTjQtZxUoFwUx4%2F-MTA7eEsruhjQu4t2fFf%2F-MTACEmgHOc47vPb0aqN%2Fimage.png?alt=media\&token=a210bb84-7153-432a-851d-509f5fb5b00c)

*See the sample message for an individual:*

![](https://3582076375-files.gitbook.io/~/files/v0/b/gitbook-legacy-files/o/assets%2F-MGIlBSTjQtZxUoFwUx4%2F-MTAmZFHjzDspOLMSAfT%2F-MTAnHnPiszW9Vt7_UlL%2Fimage.png?alt=media\&token=b7b15a9a-d6d3-41f2-b261-b078c44c5566)

*See the sample message for a team:*

![](https://3582076375-files.gitbook.io/~/files/v0/b/gitbook-legacy-files/o/assets%2F-MGIlBSTjQtZxUoFwUx4%2F-MTAnQkS9lhFOuHO4K4S%2F-MTAnflY07Ow_eBb4zFu%2Fimage.png?alt=media\&token=b3da53b4-7b20-4c3c-9c0d-c118a8d190b8)

## QAD-1.1.0 - *Gitwiser Pull Request Analytics*

*See all the changes live in QA Dashboard Playground...*  :point\_right: [*Go to Playground*](https://playground.dashboard.qa)

### :new: New Features

* **Gitwiser Pull Request Analytics:** We have launched the Pull Request Analytics (PRA) module of Gitwiser for **GitLab** and **Azure DevOps**. *Bitbucket Server* and *Bitbucket Cloud* are on the way...  \
  With this release, Gitwiser has two modules: *Repository Analytics & Pull Request Analytics*.

![](https://3582076375-files.gitbook.io/~/files/v0/b/gitbook-legacy-files/o/assets%2F-MGIlBSTjQtZxUoFwUx4%2F-MRK5qfqNCiVJr-MFwo2%2F-MRK81bQximou74ewHJZ%2Fimage.png?alt=media\&token=34dd573f-e4e2-4c09-ae27-6fd40da81a17)

* You can analyze the pull requests of existing repositories in Gitwiser by clicking the start button on the PRA tab:

![](https://3582076375-files.gitbook.io/~/files/v0/b/gitbook-legacy-files/o/assets%2F-MGIlBSTjQtZxUoFwUx4%2F-MRKAffF0WyeeC2pgP39%2F-MRKFwrt2AJmRdfteZOC%2Fimage.png?alt=media\&token=19110c0f-d298-48f2-b26b-ff2a587f3aa4)

* You can select the "**Analyze Pull Requests**" option to perform PRA for the new Gitwiser analysis.

![](https://3582076375-files.gitbook.io/~/files/v0/b/gitbook-legacy-files/o/assets%2F-MGIlBSTjQtZxUoFwUx4%2F-MRK5qfqNCiVJr-MFwo2%2F-MRK9Np5d53zphDtqKJi%2Fimage.png?alt=media\&token=392f1825-5473-47d5-a207-c9e30c2e9ee8)

* **PRA Widgets:** PRA has five widgets now: *Code Review Cycle Time, Coding Time, Time To Merge, Pull Request Size, and Work in Progress.*
* **Code Review Cycle Time (time-to-review):** You can see the **stale** pull requests in red below. If code review time took longer than the goal, the pull request is identified as stale. Long review time is a blocker for development teams.

![Code Review Cycle Time widget](https://3582076375-files.gitbook.io/~/files/v0/b/gitbook-legacy-files/o/assets%2F-MGIlBSTjQtZxUoFwUx4%2F-MRKAffF0WyeeC2pgP39%2F-MRKFfY_ebNbkHGufRzF%2Fimage.png?alt=media\&token=9dbb0ac5-b5c2-48e1-bbfe-e343a57160c0)

* **Coding Time (time-to-open):** The time elapsed between the first commit and open time for pull requests. Long coding time may block developers to see the problems earlier. Long coding time is a major risk for the high cycle time. Developers should break large features into small pieces and keep the coding time short for each pull request.
* **Time To Merge:** The time elapsed between the first commit and merge time.
* **Pull Request Size:** Total size (lines added, removed, and changed) of pull requests.

![Pull Request Size widget](https://3582076375-files.gitbook.io/~/files/v0/b/gitbook-legacy-files/o/assets%2F-MGIlBSTjQtZxUoFwUx4%2F-MRKAffF0WyeeC2pgP39%2F-MRKEkbkOI3dYNTZGzyv%2Fimage.png?alt=media\&token=8467c891-76b0-47da-8a54-36b9cb188ade)

* **Work in Progress:** Shows the open pull requests and bottlenecks of the development process. You can see the risky pull requests and take action to resolve them earlier. Alerts and reminders for open pull requests can help you improve your cycle time.

![Work in Progress PRs](https://3582076375-files.gitbook.io/~/files/v0/b/gitbook-legacy-files/o/assets%2F-MGIlBSTjQtZxUoFwUx4%2F-MRKAffF0WyeeC2pgP39%2F-MRKEq6vxvQBID4G4IkQ%2Fimage.png?alt=media\&token=6cf6c191-ffa6-4f87-8fb4-0fa448864ebd)

* **PRA Goals:** You can set goals for each pull request metric. :dart:&#x20;

![](https://3582076375-files.gitbook.io/~/files/v0/b/gitbook-legacy-files/o/assets%2F-MGIlBSTjQtZxUoFwUx4%2F-MRKAffF0WyeeC2pgP39%2F-MRKGt-IaJkERJWFP0eJ%2Fimage.png?alt=media\&token=5a4f36f5-a841-478c-8d00-032a9a8ea83b)

* **Jira Metrics with JQL Widget:** We have added a new predefined widget for Jira Addon. By using this widget, you can add your own metrics using Jira Query Language (JQL) syntax.

![If you define the second JQL, a ratio will be calculated to display in the widget.](https://3582076375-files.gitbook.io/~/files/v0/b/gitbook-legacy-files/o/assets%2F-MGIlBSTjQtZxUoFwUx4%2F-MRKP77TeeCX7NLA6CeK%2F-MRKb0mGfa_VqWwBJVfr%2Fimage.png?alt=media\&token=e3c75e54-8697-4167-965d-8a74df420575)

![Metrics with JQL widget](https://3582076375-files.gitbook.io/~/files/v0/b/gitbook-legacy-files/o/assets%2F-MGIlBSTjQtZxUoFwUx4%2F-MRKP77TeeCX7NLA6CeK%2F-MRKaOAbraY8SGuHVtpe%2Fimage.png?alt=media\&token=1acd7f2f-d854-4a20-91ab-6d97cc326262)

* **Duplicate Widget:** We have added a duplication option for the widgets.&#x20;

![](https://3582076375-files.gitbook.io/~/files/v0/b/gitbook-legacy-files/o/assets%2F-MGIlBSTjQtZxUoFwUx4%2F-MRKbc4no70BdR2ayB-U%2F-MRKcKwhzBQu_SZMwsmV%2Fimage.png?alt=media\&token=20bcf7b0-4cd4-47ed-819b-c2ae1e4cc3f4)

## QAD-1.0.40 - *Azure Active Directory, Azure Container Registry, Azure DevOps Board Metrics...*

*See all the changes live in QA Dashboard Playground...*  :point\_right: [*Go to Playground*](https://playground.dashboard.qa)

### :new: New Features

* **Azure Active Directory Integration:** We have launched Azure AD integration as a new authentication type.

![](https://3582076375-files.gitbook.io/~/files/v0/b/gitbook-legacy-files/o/assets%2F-MGIlBSTjQtZxUoFwUx4%2F-MQGpftBNzwDWwCIktAL%2F-MQGqOzz5An73ON7pm_-%2Fimage.png?alt=media\&token=b6a9f8d4-bbf0-4cb5-a5ed-707bd775937f)

* Admin Settings for Azure AD:

![](https://3582076375-files.gitbook.io/~/files/v0/b/gitbook-legacy-files/o/assets%2F-MGIlBSTjQtZxUoFwUx4%2F-MQGpftBNzwDWwCIktAL%2F-MQGqGd7hqdpe-KDmgOH%2Fimage.png?alt=media\&token=bf362c97-f715-4dee-bb72-15c03d9bf9ba)

* **Azure DevOps Widgets:** We have added new scopes (**Boards & Sprints**) and predefined widgets (**Board Metrics, Work Distribution, Sprint Size**) for Azure DevOps Addon.&#x20;

![Azure DevOps Widget Scopes](https://3582076375-files.gitbook.io/~/files/v0/b/gitbook-legacy-files/o/assets%2F-MGIlBSTjQtZxUoFwUx4%2F-MRKNvKxBcVkNVAHJMem%2F-MRKOOrOeumnviP_g2zs%2Fimage.png?alt=media\&token=00978d73-bf43-4f91-b49b-cc442ae461b9)

You can create your own metrics by using work item queries (WIQL).

![](https://3582076375-files.gitbook.io/~/files/v0/b/gitbook-legacy-files/o/assets%2F-MGIlBSTjQtZxUoFwUx4%2F-MQGpftBNzwDWwCIktAL%2F-MQGrP-c6cmgYXqmAnMd%2Fimage.png?alt=media\&token=768dbd53-53df-4132-87fe-59863b4e528b)

![](https://3582076375-files.gitbook.io/~/files/v0/b/gitbook-legacy-files/o/assets%2F-MGIlBSTjQtZxUoFwUx4%2F-MQGpftBNzwDWwCIktAL%2F-MQGsi06GKbtZBNo-yfi%2Fimage.png?alt=media\&token=810fd95a-4956-4224-817e-6a704c28a5cf)

* **Note:** If you define the second metric WIQL, a ratio will be calculated to display in the widget.

`Ratio formula = (metric1 / metric2) * 100`

* **Azure Container Registry:** We have built automation for **Azure Container Registry** to keep our customers using AKS up-to-date.

&#x20;

## QAD-1.0.38 - *Team Scorecard multiple branch support,* *Performance & UI/UX Improvements...*

*See all the changes live in QA Dashboard Playground...*  :point\_right: [*Go to Playground*](https://playground.dashboard.qa)

### :new: New Features

* **SonarQube Branch Support for Team Scorecards:** We have added a project-branch mapping field to the Team Scorecard settings in order to enable ***custom branch selection for Team Scorecards.***&#x20;
* We have added unit test and coverage results to the Azure DevOps Build Details widget.

![](https://3582076375-files.gitbook.io/~/files/v0/b/gitbook-legacy-files/o/assets%2F-MGIlBSTjQtZxUoFwUx4%2F-MQGpftBNzwDWwCIktAL%2F-MQGs9xtHVbpdXAZJWlT%2Fimage.png?alt=media\&token=1bcb805b-aef2-43d1-a2f8-9549bbcfd039)

### :muscle: Improvements

* Increased performance :rocket: of [Gitwiser](broken://pages/-MGIrMC8EqiUIlw9lI0P) analysis main page.
* We have added a cancel option for the running Gitwiser analysis.

![](https://3582076375-files.gitbook.io/~/files/v0/b/gitbook-legacy-files/o/assets%2F-MGIlBSTjQtZxUoFwUx4%2F-MQGgV-Z5__aW86sdt6R%2F-MQGkq81uQ7rK0IYJUtt%2Fimage.png?alt=media\&token=a199f40f-e9f3-43b6-a354-a0c33c92eb5c)

* We have added a progress bar on Gitwiser analysis.

![](https://3582076375-files.gitbook.io/~/files/v0/b/gitbook-legacy-files/o/assets%2F-MGIlBSTjQtZxUoFwUx4%2F-MQGgV-Z5__aW86sdt6R%2F-MQGkyHXXFSv17Lq2jAr%2Fimage.png?alt=media\&token=7e667fa7-48f0-4bef-9964-e9748db90c68)

### :lady\_beetle: Fixes

* Fixed- branch group problem on Azure DevOps Gitwiser analysis.
* Fixed- Timezone problem on Gitwiser.

## QAD-1.0.37 - *SonarQube multiple branch support, Cosmos DB,* *Performance & UI/UX Improvements...*

*See all the changes live in QA Dashboard Playground...*  :point\_right: [*Go to Playground*](https://playground.dashboard.qa)

### :new: New Features

* **SonarQube Branch Support for Dashboards:** We have added branch selection option for SonarQube widgets on Dashboards. If you analyze multiple branches on SonarQube projects, you are now able to select the branch that you want to track on QA Dashboard widgets.&#x20;

![](https://3582076375-files.gitbook.io/~/files/v0/b/gitbook-legacy-files/o/assets%2F-MGIlBSTjQtZxUoFwUx4%2F-MIwmjtEqwoOf3BrrQAP%2F-MIwsgVp-ktIrLMGCosX%2Fimage.png?alt=media\&token=802467bd-8b3e-4f5c-a651-4f9900a279e8)

* **SonarQube Branch Support for Developer Scorecards:** We have added a project-branch mapping field to the administrator settings in order to enable ***custom branch selection for Developer Scorecards.*** You can prefer using default branch of analysis, or you can define your own default branch name for all projects, or you can define custom project & branch mapping to track branches specific to any project.&#x20;

![](https://3582076375-files.gitbook.io/~/files/v0/b/gitbook-legacy-files/o/assets%2F-MGIlBSTjQtZxUoFwUx4%2F-MIwmjtEqwoOf3BrrQAP%2F-MIwv-4nuwM9imcd4DfV%2Fimage.png?alt=media\&token=9760017d-1a9f-4b5a-ba5d-757ef0c2881b)

* We have just launched a new support for Azure **Cosmos DB**. :tada:&#x20;

### :muscle: Improvements

* Increased performance :rocket: of [Gitwiser](broken://pages/-MGIrMC8EqiUIlw9lI0P) analysis result page.
* UX - We have formatted the file name of the downloaded scorecards. *(ProfileName-Scorecard-2020-09-22.jpeg)*
* UX - We have added links for *documentation* and *contact* to the footer.

### :lady\_beetle: Fixes

* Fixed- contribution ratio problem on scorecards.
* Fixed- timeline graph problem on widgets.
* Fixed- sending biweekly email report problem.
* Fixed- missing GitLab merged\_at parameter problem on GitLab Merge Requests widget.

## QAD-1.0.36 - *Contributions Graph, Company Avg, Performance Improvements...*&#x20;

*See all the changes live in QA Dashboard Playground...*  :point\_right: [*Go to Playground*](https://playground.dashboard.qa)

### :new: New Features

* **Contributions Graph** - We have added a new widget to [*Developer Scorecards*](/scorecards/individual-scorecards) in order to show you a "contributions graph" by using [Gitwiser ](broken://pages/-MGIrMC8EqiUIlw9lI0P)repository analysis data. Now you can see your active contribution days on a calendar heatmap. :calendar\_spiral:&#x20;

![A calendar heat-map for the contributions.](https://3582076375-files.gitbook.io/~/files/v0/b/gitbook-legacy-files/o/assets%2F-MGIlBSTjQtZxUoFwUx4%2F-MHuc2CGihcIOSto-6JT%2F-MHuiESxcXpoBrvWAE2k%2Fimage.png?alt=media\&token=8e10fc0f-1073-4281-916f-dbab737b3141)

* **Company Average For Metrics** - You can now see the "*company average*" value for the metrics on Developer Scorecard in order to know where you stand in your organization. :chart\_with\_upwards\_trend:&#x20;

![](https://3582076375-files.gitbook.io/~/files/v0/b/gitbook-legacy-files/o/assets%2F-MGIlBSTjQtZxUoFwUx4%2F-MHuc2CGihcIOSto-6JT%2F-MHuihFgL51HZCEeTV2G%2Fimage.png?alt=media\&token=6142b93b-ada1-4b74-a539-1603e14df9a7)

* **Download Scorecards** - You can now download the scorecards as images.&#x20;

### :muscle: Improvements

* Increased performance for [Gitwiser](broken://pages/-MGIrMC8EqiUIlw9lI0P) XL repository analysis. :rocket:&#x20;
* Increased performance for [Gitwiser widgets](/scorecards/individual-scorecards#contribution-statistics) on Scorecards. :rocket:&#x20;
* We have added a linking option for the "Widget Header Note". :pencil2:&#x20;

![](https://3582076375-files.gitbook.io/~/files/v0/b/gitbook-legacy-files/o/assets%2F-MGIlBSTjQtZxUoFwUx4%2F-MHznmp5eDQ6_ceQ4KfQ%2F-MHzpXZVpmij-Pg83-x4%2Fimage.png?alt=media\&token=ddaa4e0b-14b6-4415-b11d-d7ed39b1bd03)

### :lady\_beetle: Fixes

* [Gitwiser account mapping](/scorecards/individual-scorecards#related-accounts-of-developer) is now case-insensitive. :abc:&#x20;
* Added new statuses (reopened, confirmed) for building of [SonarQube ](/integrations/all-integrations/code-quality-addons/sonarqube-integration)Open Issues web link.&#x20;

## QAD-1.0.35 - *Dashboard Info drawer, UI/UX Improvements...*

*See all the changes live in QA Dashboard Playground...*  :point\_right: [*Go to Playground*](https://playground.dashboard.qa)

### :new: New Features

* **Dashboard Info** - We have added a drawer to show information about the Dashboard. We will also add audit information in future releases.

![](https://3582076375-files.gitbook.io/~/files/v0/b/gitbook-legacy-files/o/assets%2F-MGIlBSTjQtZxUoFwUx4%2F-MHzcL7anhN0vDSWWizP%2F-MHzgOlLatpW6AY0IV2Z%2Fimage.png?alt=media\&token=bebf8fa7-3d09-472e-9d79-447a59c1a500)

### :muscle: Improvements

* **UX** - All drop-down lists are sorted from A to Z.
* **UX** - We have added "*Read the docs*" links to [addon information](/integrations/adding-new-integration/installing-an-addon) pop-up in order to navigate the user to the manual.

### :lady\_beetle: Fixes

* We no longer support "*Contributor Widget"* for TFVC scope in Azure DevOps widgets. You can use [Gitwiser](broken://pages/-MGIr_Ok2Wq0_M0SIia0) widget scope to visualize TFVC contribution metrics.

## QAD-1.0.34 - *Limited Docker Edition, Download Widgets, UI/UX Improvements...*

*See all the changes live in QA Dashboard Playground...*  :point\_right: [*Go to Playground*](https://playground.dashboard.qa)

### :new: New Features

* **Limited Docker Edition** - We have launched a **free-to-use** version of [**QA Dashboard**](https://dashboard.qa) with [**limited features**](https://dashboard.qa/#pricing). :tada:You can run your own instance using Docker 🐳  to **see QA Dashboard with your own data**. For detailed information, see the documentation [here](broken://pages/-MGJBd_XLkkttJB500Ff). 📋&#x20;
* **Download Widgets** - You can now download the widgets as images.

<div align="center"><img src="https://3582076375-files.gitbook.io/~/files/v0/b/gitbook-legacy-files/o/assets%2F-MGIlBSTjQtZxUoFwUx4%2F-MHzja8vYK-tyICyP0ay%2F-MHznQdGxd0IZF791g67%2Fimage.png?alt=media&amp;token=3968c33a-dda4-4f9e-a607-1b4b3bfc6079" alt=""></div>

### :muscle: Improvements

* **Data Sources** - We have added "*Test Connection*" for [Bitbucket Cloud integration](/integrations/all-integrations/scm-addons/bitbucket-cloud-integration).

![](https://3582076375-files.gitbook.io/~/files/v0/b/gitbook-legacy-files/o/assets%2F-MGIlBSTjQtZxUoFwUx4%2F-MHzja8vYK-tyICyP0ay%2F-MHzk4bZWNG7xmQRYIsU%2Fimage.png?alt=media\&token=6ee14099-9f60-45a3-80b2-5b2bebd3fe30)

* **Data Sources** - We have set [*SonarQube API Token*](/integrations/all-integrations/code-quality-addons/sonarqube-integration#3-add-a-new-data-source) field as an optional field. You can now connect to Sonarqube instances which don't require authorization.
* **UX** - If there is only one [predefined widget](/dashboards/adding-a-new-widget#adding-a-new-widget) in the drop-down list, select it automatically in widget create modal.

### :lady\_beetle: Fixes

* Fixed long text problem on the *Azure DevOps Build Details* widget.
* Removed deprecated parameter from the date filter list.

## QAD-1.0.33 - *GitHub Addon, GitLab Merge Request Widget, UI/UX Improvements...*

*See all the changes live in QA Dashboard Playground...*  :point\_right: [*Go to Playground*](https://playground.dashboard.qa)

### :new: New Features

* **GitHub Addon -** We have launched our new integration with GitHub :tada: . \
  You can now connect to your GitHub repositories just like GitLab, Bitbucket, Azure DevOps and SVN... Learn more about GitHub & QA Dashboard integration [here](/integrations/all-integrations/scm-addons/github-integrations)...\
  You can analyze your **GitHub repositories** on ***Gitwiser*** to get insights about your development activities.&#x20;

![](https://img.announcekit.app/540307919ff28a6362fcfdd2e5f0e56b?s=3aebf81a6e8ae46a133996ab43ffa8ff)

* **GitLab Merge Requests Widgets -** We have launched a new [GitLab ](/integrations/all-integrations/scm-addons/gitlab-addon)widget to get visibility into the key *merge request* metric "**Time to Merge**" to identify the *development bottlenecks*.&#x20;

  Tracking time-to-merge (*TTM*) will reduce your **cycle time** to deliver value and increase team efficiency.

![](https://img.announcekit.app/35ba1093171c1206e915875eba4adef8?s=56838a7f29318ffa9fa7205733ca041f)

### :muscle: Improvements

* **UI/UX -** Improvements on Market Place & Data Sources pages.
* **UX -** We have added a welcome modal including a basic product tour for the new users.
* **Leagues -** Increased pagination limit from 15 to 50 on Team Scoreboard.
* **Leagues -** We have added the count of selected Objectives/KPIs. You can now see the total count of selected Objectives/KPIs on the League cards.&#x20;

![](https://3582076375-files.gitbook.io/~/files/v0/b/gitbook-legacy-files/o/assets%2F-MGIlBSTjQtZxUoFwUx4%2F-MHzpdCGn18rEtkqka-u%2F-MHzwsOurrXaeIGR8Dpl%2Fimage.png?alt=media\&token=ddc7e264-bfdc-42de-ac55-df335c5f333a)

### :lady\_beetle: Fixes

* Fixed global date filter problem for "Last 2 weeks".


---

[Next Page](/llms-full.txt/1)