> For the complete documentation index, see [llms.txt](https://docs.oobeya.io/llms.txt). Markdown versions of documentation pages are available by appending `.md` to page URLs; this page is available as [Markdown](https://docs.oobeya.io/deployment-analytics/dora-metrics-introduction.md).
# DORA Metrics Introduction
## What are DORA Metrics?
[DORA (DevOps Research and Assessment)](https://devops-research.com/) [metrics](https://oobeya.io/dora-metrics-four-key/) are a set of metrics that measure the performance of DevOps practices and processes in organizations. The metrics include [lead time, deployment frequency, mean time to restore, change failure rate](https://oobeya.io/dora-metrics-four-key/), and they aim to provide a comprehensive view of an organization’s ability to deliver value to customers. Learn more about DORA Metrics [here](https://oobeya.io/blog/how-to-measure-dora-metrics-accurately/).
## DORA Metrics Definitions
1. **Lead Time For Changes:** The amount of time it takes a commit to get into production.
2. **Deployment Frequency:** How often an organization successfully releases to production. High-performing software teams release often and in small batches.
3. **Change Failure Rate:** The percentage of deployments causing a failure in production.
4. **Time to Restore Service:** How long it takes an organization to recover from a failure in production.
***
## 1. LEAD TIME FOR CHANGES (LTC)
### 1.1. Lead Time For Changes Metric Definition
The interval between a code change and its release to the end users is considered Lead Time For Changes.
### 1.2. Lead Time For Changes Formula
{% code overflow="wrap" %}
```
Lead Time For Changes = [Production Deployment Time] - [First Commit Time of all changes]
```
{% endcode %}
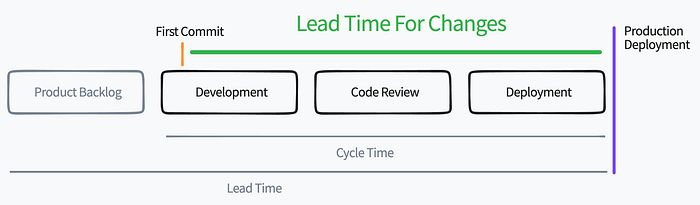
### 1.3. The Anatomy of the Lead Time and Lead Time For Changes
The image below represents the Lead Time metric's anatomy that covers the Lead Time For Changes metric.
Lead Time Breakdown
### 1.4. The Stages of the Lead Time For Changes
The Lead Time For Changes measures friction in the coding, code review, and CI/CD processes.
1. **Coding Time:** The time elapsed between the First commit and the PR opened.
2. **Code Review Time:** The time elapsed between the PR opened and the PR merged.
3. **Waiting For Deploy:** The time elapsed between the PR merged and the Deployment pipeline started.
4. **Deployment Time:** The time elapsed between the Deployment started and Deployment finished successfully.
***
## 2. DEPLOYMENT FREQUENCY (DF)
### 1.1. Deployment Frequency Metric Definition
This measures how often code changes are deployed to production.
### 1.2. Deployment Frequency Formula
Number of successful deployments to production per day.
{% code overflow="wrap" %}
```
Deployment Frequency = [Number of Successful Deployments To Production] / [Days in the selected period]
```
{% endcode %}
***
## 3. CHANGE FAILURE RATE (CFR)
### 1.1. Change Failure Rate Metric Definition
This measures the percentage of deployments causing a failure in production.
### 1.2. Change Failure Rate Formula
{% code overflow="wrap" %}
```
Change Failure Rate % = [Number of Production Deployments Caused An Incident] / [Number of Production Deployments] * 100
```
{% endcode %}
***
## 4. MEAN TIME TO RESTORE SERVICE (MTTR)
### 1.1. Mean Time To Restore Service Metric Definition
This measures how long it takes to restore service after a production incident.
### 1.2. Mean Time To Restore Service Formula
{% code overflow="wrap" %}
```
Mean Time To Restore Service = avg ([Incident Resolved] - [Incident Created])
```
{% endcode %}
***
## What sets Oobeya apart as the top-notch DORA Metrics tracking tool?
Oobeya developed a mechanism for calculating [DORA Metrics](https://oobeya.io/dora-metrics-four-key/) across platforms/tools (VCS, CICD, and APM-Incident Management tools) so that any organization can accurately and effortlessly track the journey of a commit from development to production deployment.
Furthermore, no changes to workflows or pipelines are required; Oobeya seamlessly integrates with existing tools to calculate DORA metrics.
Oobeya DORA Metrics
## DORA Metrics Blog Posts :books:
[How to Measure DORA Metrics Accurately? ](https://oobeya.io/blog/how-to-measure-dora-metrics-accurately/)
> DORA metrics are quite popular in the industry. However, working with them is extremely difficult. Let’s take a look at how your company can calculate and track DORA Metrics to gain complete visibility into complex delivery cycles.
[How To Reduce Lead Time For Changes (Optimizing DORA Metrics)](https://oobeya.io/blog/how-to-reduce-lead-time-for-changes-dora-metrics/)
> In this article, we will take a closer look at one of [DORA Metrics](https://oobeya.io/dora-metrics-four-key/), **Lead Time For Changes** (Change Lead Time), and how it can be reduced to optimize software development and delivery processes.
[DORA Metrics Tracking: How to Effectively Detect Production Failures](https://oobeya.io/blog/dora-metrics-tracking-how-to-effectively-detect-production-failures/)
> Detecting production failures is the most critical and challenging component of tracking DORA metrics. While it can be challenging, organizations can overcome these challenges by using the right tools and following best practices.
## How-to Docs :bookmark\_tabs:
{% content-ref url="/pages/xwNtrccGWk9PLxs9Q0DA" %}
[How To Calculate DORA Metrics for GitHub](/deployment-analytics/how-to-calculate-dora-metrics-for-github.md)
{% endcontent-ref %}
{% content-ref url="/pages/0Tk4alYkV6h5AGMrmNQp" %}
[How To Calculate DORA Metrics for Azure DevOps](/deployment-analytics/how-to-calculate-dora-metrics-for-azure-devops.md)
{% endcontent-ref %}
{% content-ref url="/pages/Yru5eYX9F1OfGITVCP3G" %}
[How To Start Deployment Analytics (DORA Metrics) For An Existing Gitwiser Analysis](/gitwiser-repo-analytics/deployment-analytics-dora-metrics/how-to-start-deployment-analytics-dora-metrics-for-an-existing-gitwiser-analysis.md)
{% endcontent-ref %}
{% content-ref url="/pages/pSWxvpeIpmEbo7hKWE62" %}
[Updating Team Scorecard configuration to display DORA Metrics](/team-health/updating-team-scorecard-configuration-to-display-dora-metrics.md)
{% endcontent-ref %}